Analysis of Thursday trades:
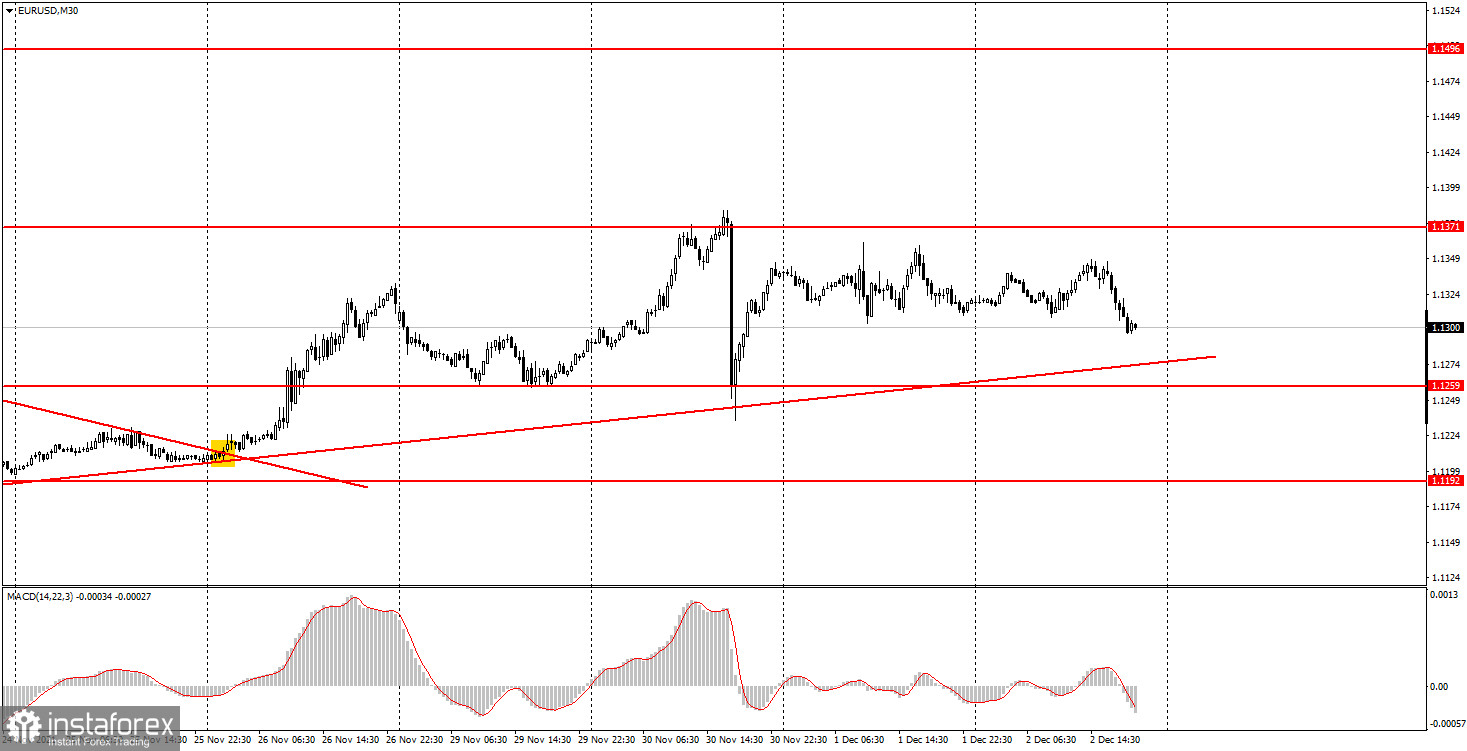
M30 chart

On Thursday, the EUR/USD pair mainly moved sideways, according to the M30 chart. Despite the sideways movement, the market is still bullish. The price is likely to go down or bounce to the ascending trendline any time soon, which is going to make a buy signal. Otherwise, if the quote breaks through the ascending trendline, it is going to produce a sell signal. So far, bulls have made several unsuccessful attempts to push the pair upward. On Thursday, December 2, the macroeconomic calendar was empty both in the eurozone and in the United States, as well as there were no interesting fundamentals that could somehow affect the market. The unemployment rate was the only important report released in the eurozone. The reading dropped to 7.3% versus 7.4%. Anyway, markets showed no reaction to the results. The publication of weekly jobless claims in the United States went unnoticed as well. No other crucial macroeconomic data was published on Thursday.
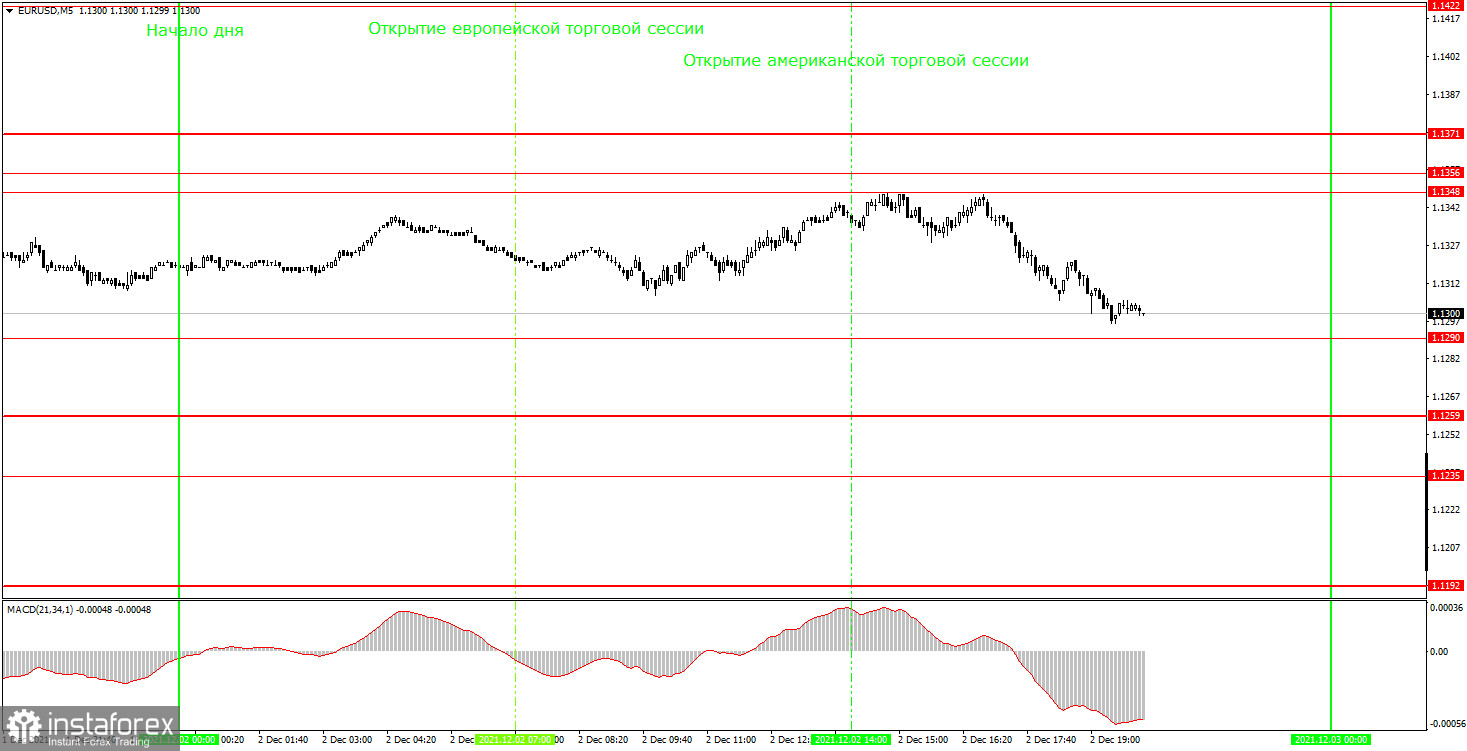
M5 chart

According to the M5 chart, volatility was at a very low level, about 50 pips. The euro/dollar pair has not reached the level of 1.1384 yet. This mark is the Thursday high, and entry points near it could be produced today. The quote did not test any of the important levels on Thursday. Therefore, no entry points were formed. This is probably for the best because the pair started to move only during the North American session. Until then, only false entry points could be produced due to the sideways movement.
Outlook for EUR/USD:
Based on the M30 chart, the bearish trend stopped. At the same time, the pair shows a sluggish upward movement. The euro is likely to remain bullish for some time, or rather these are going to be weak attempts of traders to push the pair slightly upward. Anyway, as long as the ascending trendline remains relevant, buying will remain more appropriate than selling. The key levels for December 3 on the M5 chart are 1.1235, 1.1259, 1.1290, 1.1348 - 1.1356, and 1.1371. A take-profit order is to be set at a distance of 30-40 pips. A stop-loss order is to be placed at the breakeven point when the quote passes 15 points in the required direction. On the M5 chart, the target will be seen at the nearest level if it is not located too close or too far. Otherwise, you should take it from there or work according to Take Profit. On Friday, some crucial reports are set to be released. So, novice traders will have something to turn their attention to. The most significant event of the day will be the publication of NonFarm Payrolls in the US. This indicator shows how many new jobs were created during the month outside the agricultural sector. This report reflects the state of the jobs market, and the Federal Reserve's main priority now is its recovery from the crisis and return to full employment. That is why this data is so important. In addition, the US will publish statistics on the unemployment rate and the service PMI. They are less significant but still crucial reports. In the eurozone, the services PMI and retail sales are scheduled for release today.
Major rules of trading:
1) The strength of a signal is calculated by the time it took a signal to form (bounce or break through the level). The less time it takes, the stronger is the signal.
2) If two or more trades are opened near a certain level based on false signals (which did not trigger a Take Profit order or a test of the nearest target level), then all subsequent signals from this level should be ignored.
3) Being flat, any pair might form a lot of false signals or non at all. In any case, when seeing the first signs of a flat, trading should be stopped.
4) Trades are opened within the time period between the opening of the European session and the middle of the North American session when all trades should be closed manually.
5) On the M30 chart, trading should be carried out based on signals from the MACD indicator only if there is good volatility or a trend confirmed by a trend line or a channel.
6) If two levels are located close to one another (from 5 to 15 pips), they should be considered as the area of support or resistance.
Indicators on charts:
Support and resistance are target levels when buying or selling a pair. A Take-profit order could be set near them.
Red lines are channels or trend lines that display the current trend and show in what direction it is preferable to trade now.
MACD (14, 22, 3) - a histogram and a signal line, the crossing of which produces a signal to enter the market. It should be used in combination with trend patterns (channels, trend lines).
Important speeches and reports (always contained in the calendar) can greatly influence the movement of a currency pair. Therefore, at the time of publication, market players should trade very cautiously or exit the market to avoid a reversal.
Beginners should remember that not every trade will be profitable. An effective trading strategy and money management are the keys to success in long-term trading.


