


Trend analysis
This week, the price from the level of 1.3229 (closing of the last weekly candle) is expected to surge to the target of 1.3347 – the pullback level of 14.6% (yellow dotted line). After reaching this level, it may continue its growth to the target of 1.3442 – the pullback level of 23.6% (yellow dotted line).
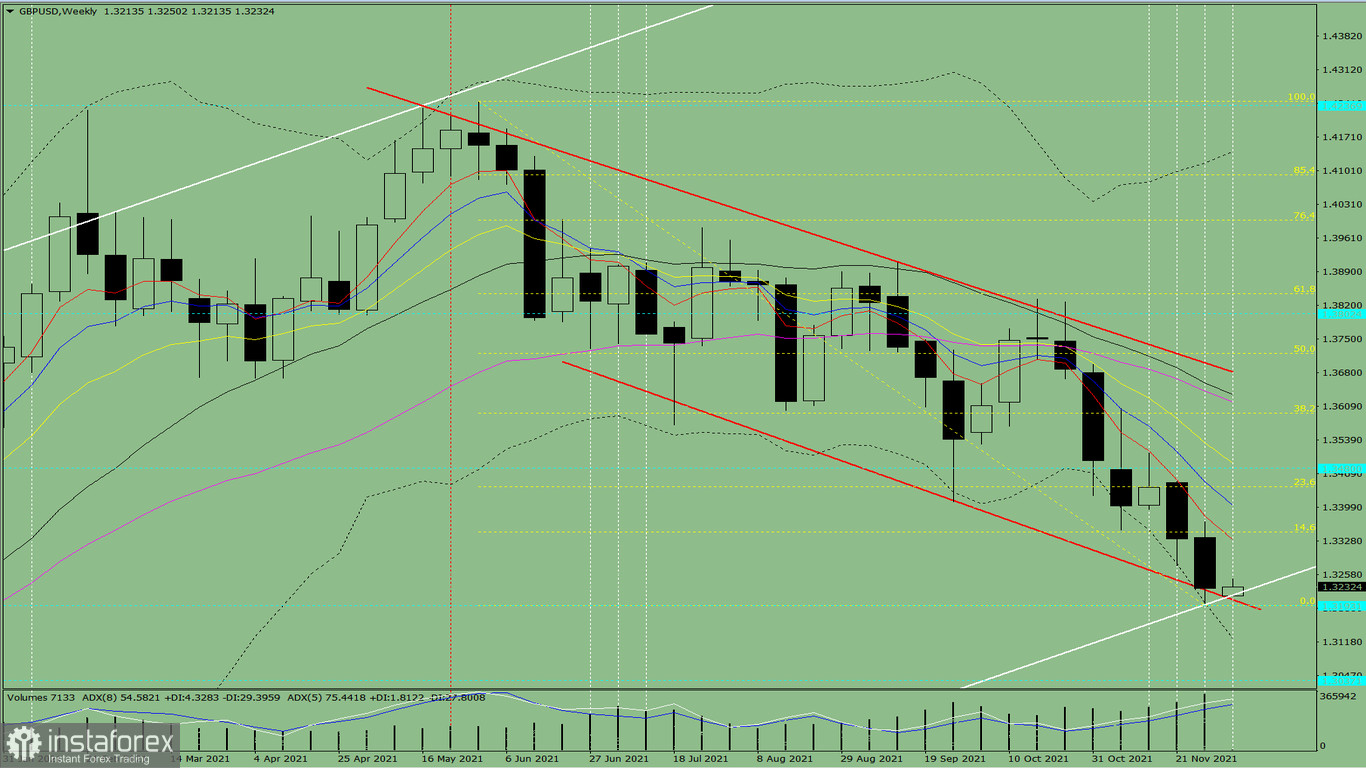
Figure 1 (weekly chart)
Comprehensive analysis:
- Indicator analysis - up
- Fibonacci levels - up
- Volumes - up
- Candlestick analysis - up
- Trend analysis - up
- Bollinger lines - up
- Monthly chart - up
An upward movement can be concluded based on a comprehensive analysis.
The overall result of the candlestick calculation based on the weekly chart: the price will most likely move in an upward trend, without the first lower shadow (Monday - up) and with the second upper shadow (Friday - down) in the weekly white candlestick.
The price from the level of 1.3229 (closing of the last weekly candle) will move up to the target of 1.3347 – the pullback level of 14.6% (yellow dotted line). After reaching it, the upward movement is possible to the target of 1.3442 – the pullback level of 23.6% (yellow dotted line).
As an alternative, the price from level 1.3229 (closing of the last weekly candle) may fall to the target of 1.3037 – the historical support level (blue dotted line). Once this level is reached, it may start rising to the target of 1.3204 – the resistance line (red bold line).


