Technical Market Outlook:
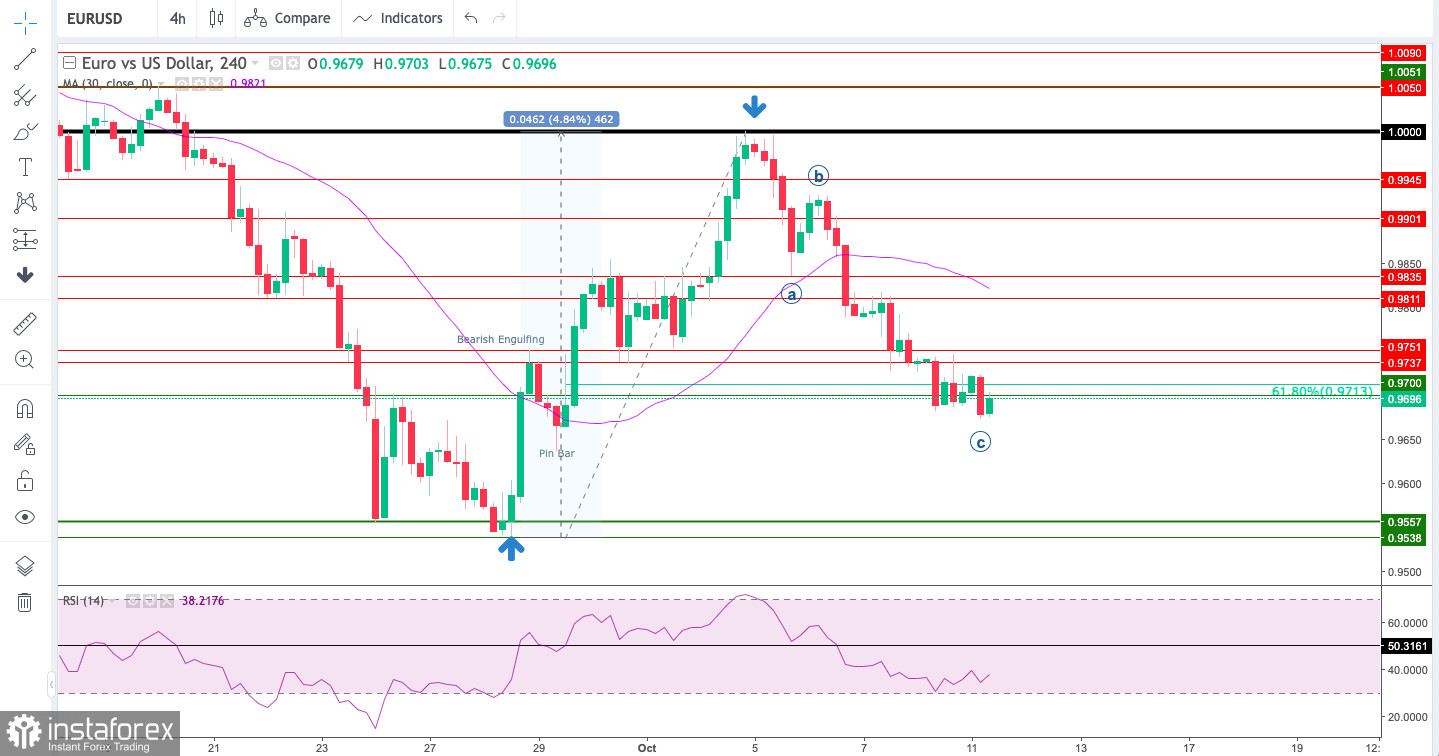
The EUR/USD pair had reversed from the parity level again and continues to retrace the last wave up. The bears has hit the level of 0.9713, which is the 61% of the Fibonacci retracement level and new local lows were made at the level of 0.9673 (at the time of writing the article). The nearest technical support is seen at 0.9557 and 0.9538 and the next technical resistance is seen at 0.9737 and 0.9751. The projected target for the wave C is located at the 61% Fibonacci retracement seen at 0.9713, so please expect an increase in bullish activity around this level. In the longer term, the key technical resistance level is located at 1.0389 (swing high from August 11th), so the bulls still have a long road to take before the down trend reversal is confirmed. Please watch the USDX as the correlation between this two markets (EUR/USD and USDX) is directly opposite. The mid and long-term outlook for the EUR remains bearish until the swing high seen at 1.0389 is clearly broken.

Weekly Pivot Points:
WR3 - 0.97965
WR2 - 0.97677
WR1 - 0.97535
Weekly Pivot - 0.97389
WS1 - 0.97247
WS2 - 0.97101
WS3 - 0.96813
Trading Outlook:
Despite the recent bounce, the EUR/USD market is still under the strong bearish pressure and as long as the USD is kept being bought all across the board, the down trend will continue far below the parity level, towards the new multi-year lows. In the mid-term, the key technical resistance level is located at 1.0389 and only if this level is clearly violated, the down trend might be considered terminated. Please notice, there is plenty of down room for the EUR to go as the bears keep making a new, multi-year lows.


