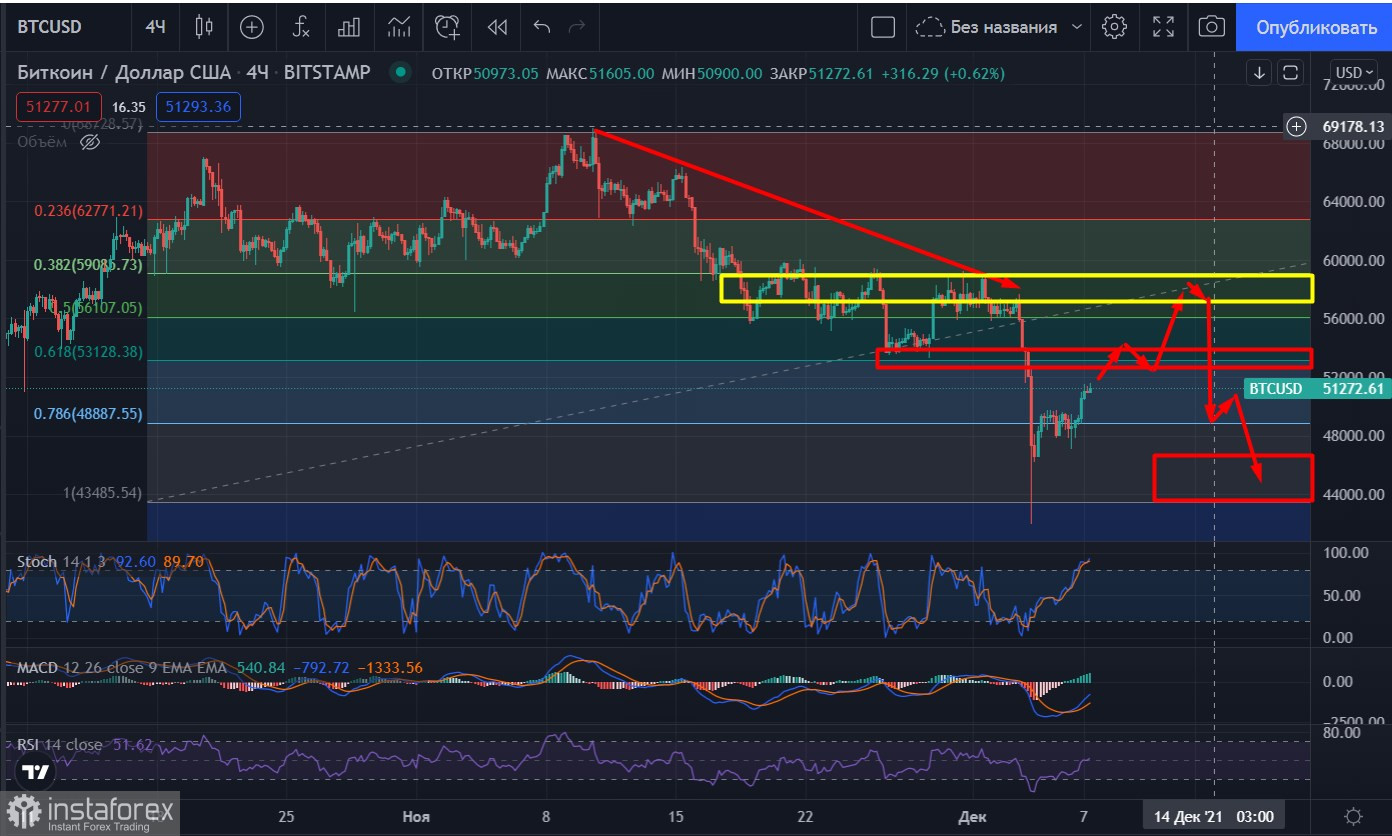
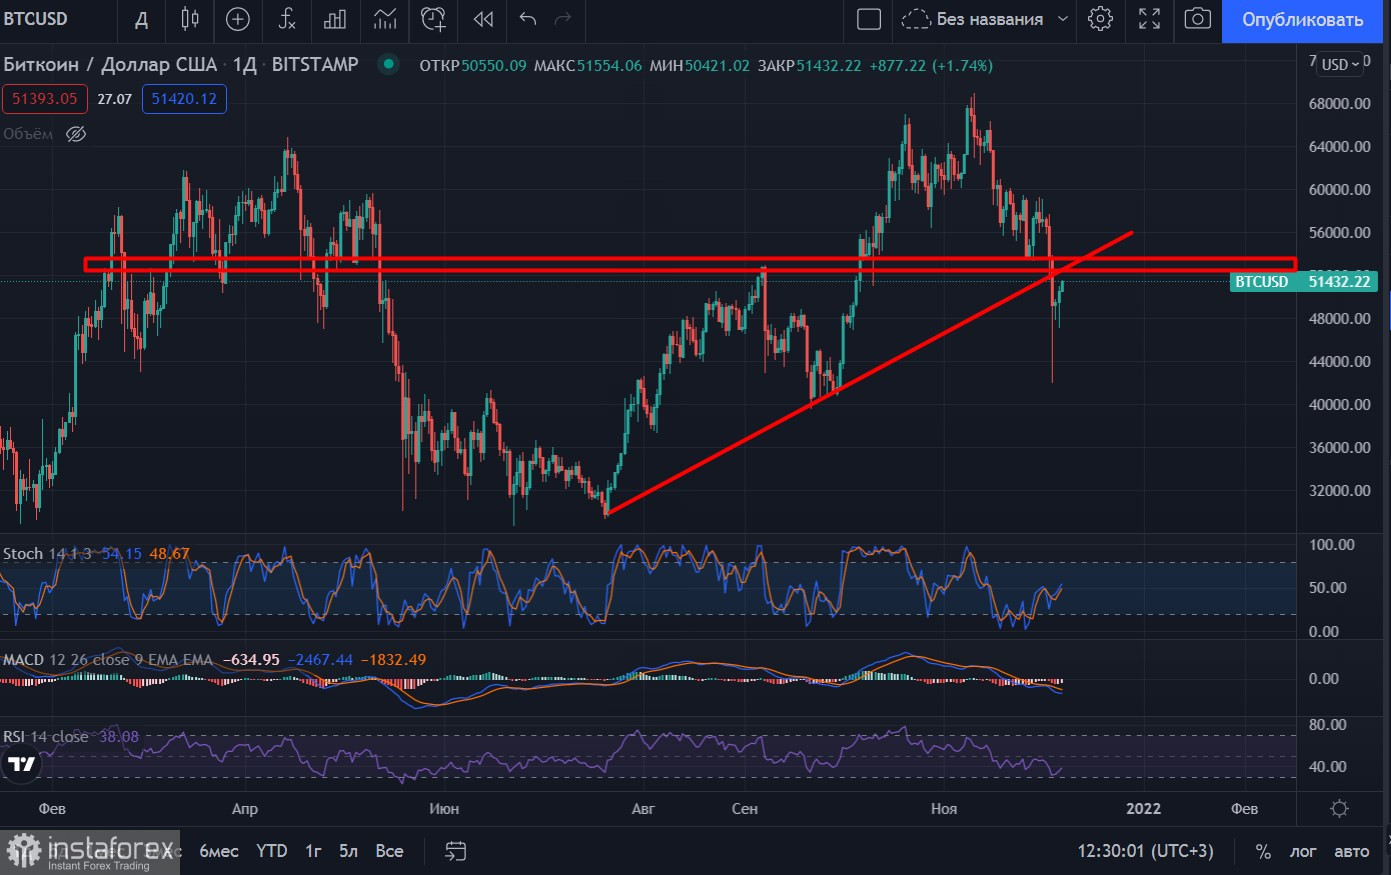
BTC has begun to recover following its bounce off the bottom at $41,900. The cryptocurrency has retaken the $50,000 mark and is now approaching the key resistance area. Despite the earlier dive and a breakout below the trend line, Bitcoin could resume its upside movement and set a new all-time high.
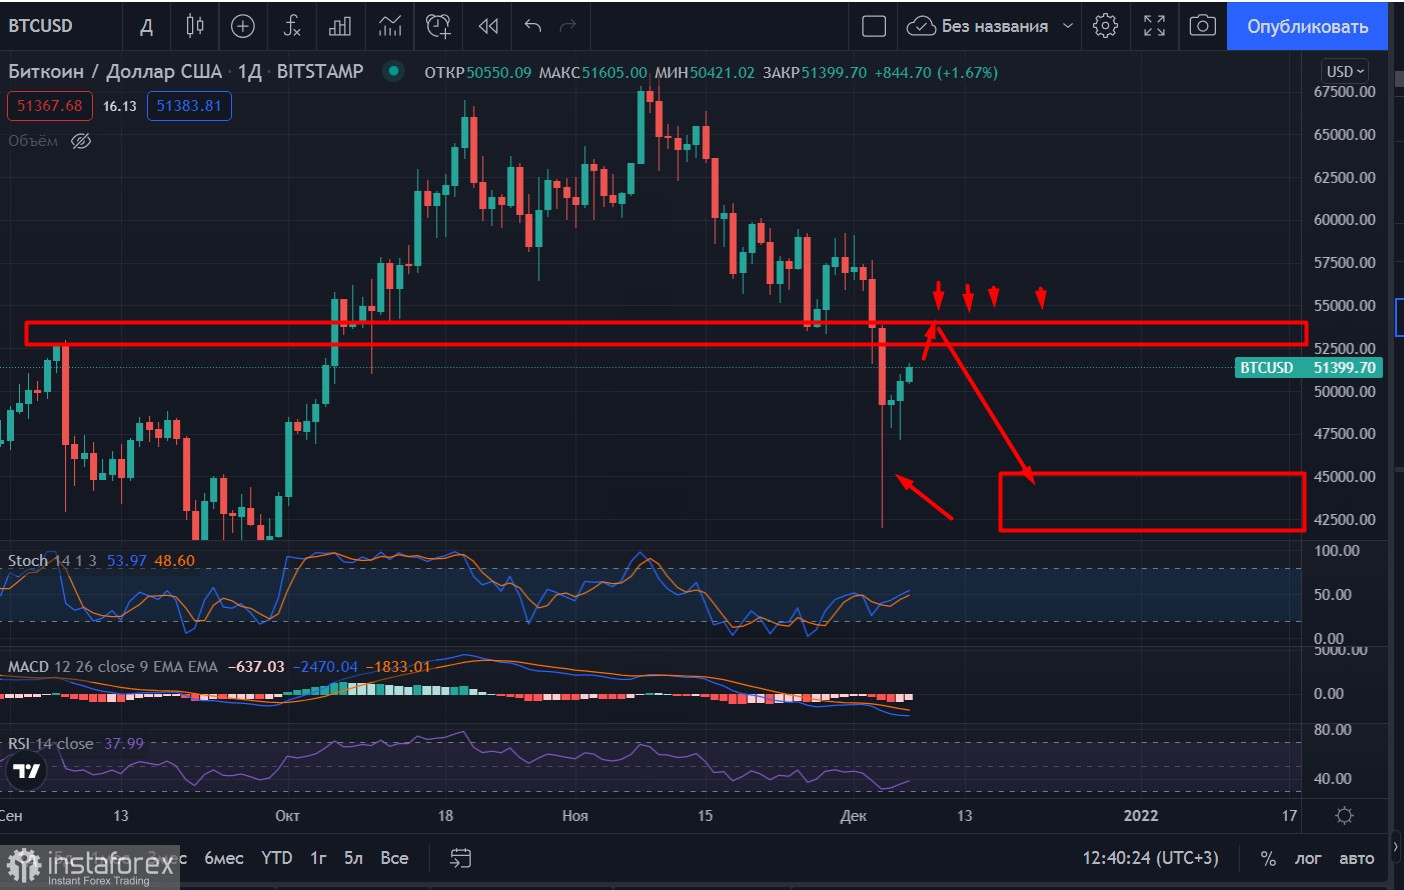
The asset could test the $52,700-$54,000. There is enough space for traders to maneuver after one of the biggest selloffs in history, and new coins are quickly bought up. There is hardly any time for opening long positions, as high amounts of coins in circulation are likely to put serious pressure on the price, negatively affecting BTC's testing of $52,700-$54,000. According to the daily chart, the bullish momentum is getting stronger, and more and more long positions would be opened in the next few days. However, this candle has yet to cover even 25% of the final impulsive bearish candlestick, which suggests the price could still rebound to $45,000-$49,000 and below.
The shadow of the final bearish candlestick is as long as at least 50% of its body. This indicates that the price could return to the $42,000-$45,000 range, ending the current bull market. Furthermore, BTC could fail to break through the resistance at $52,600-$54,000, which would extend the asset's correction. Afterwards, Bitcoin could test the channel below $45,000 once again.
There are two possible scenarios at this point. In a bullish scenario, traders have enough liquidity for the price to break above $54,000 (marked with a red arrow) and settle above it. A downward correction with a bounce off the 0,768 Fibonacci level ($49,000) or the $44,000-$47,000 area could also be possible. In this case, BTC could surpass $54,000 and finish the upward correction at $58,000 (marked with a blue arrow). This could give bitcoin enough upside potential to reach $90,000.
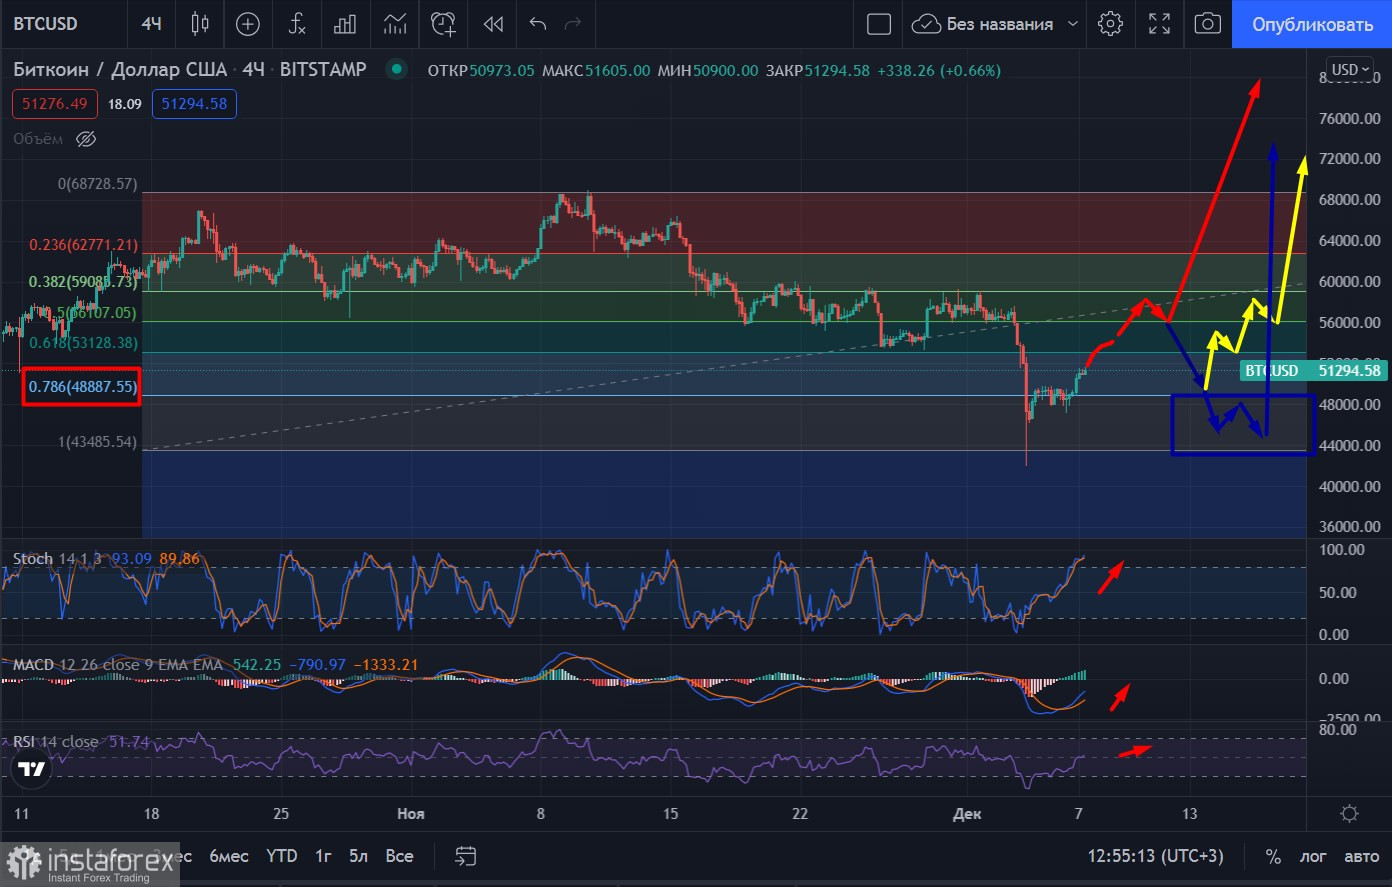
In a bearish scenario, which is less likely, BTC would successfully test the $52,700-$54,000 line and approach the counter trend line at $58,000. The price could bounce downwards off the counter trend line towards $45,000, potentially forming a double bottom pattern and putting the uptrend in danger. Tomorrow's meeting of the US Congress's House Committee on Financial Services is likely to determine whether BTC would successfully test $58,000 or not. Due to continuously high volatility, any outcome of the congressional hearings would influence investors.