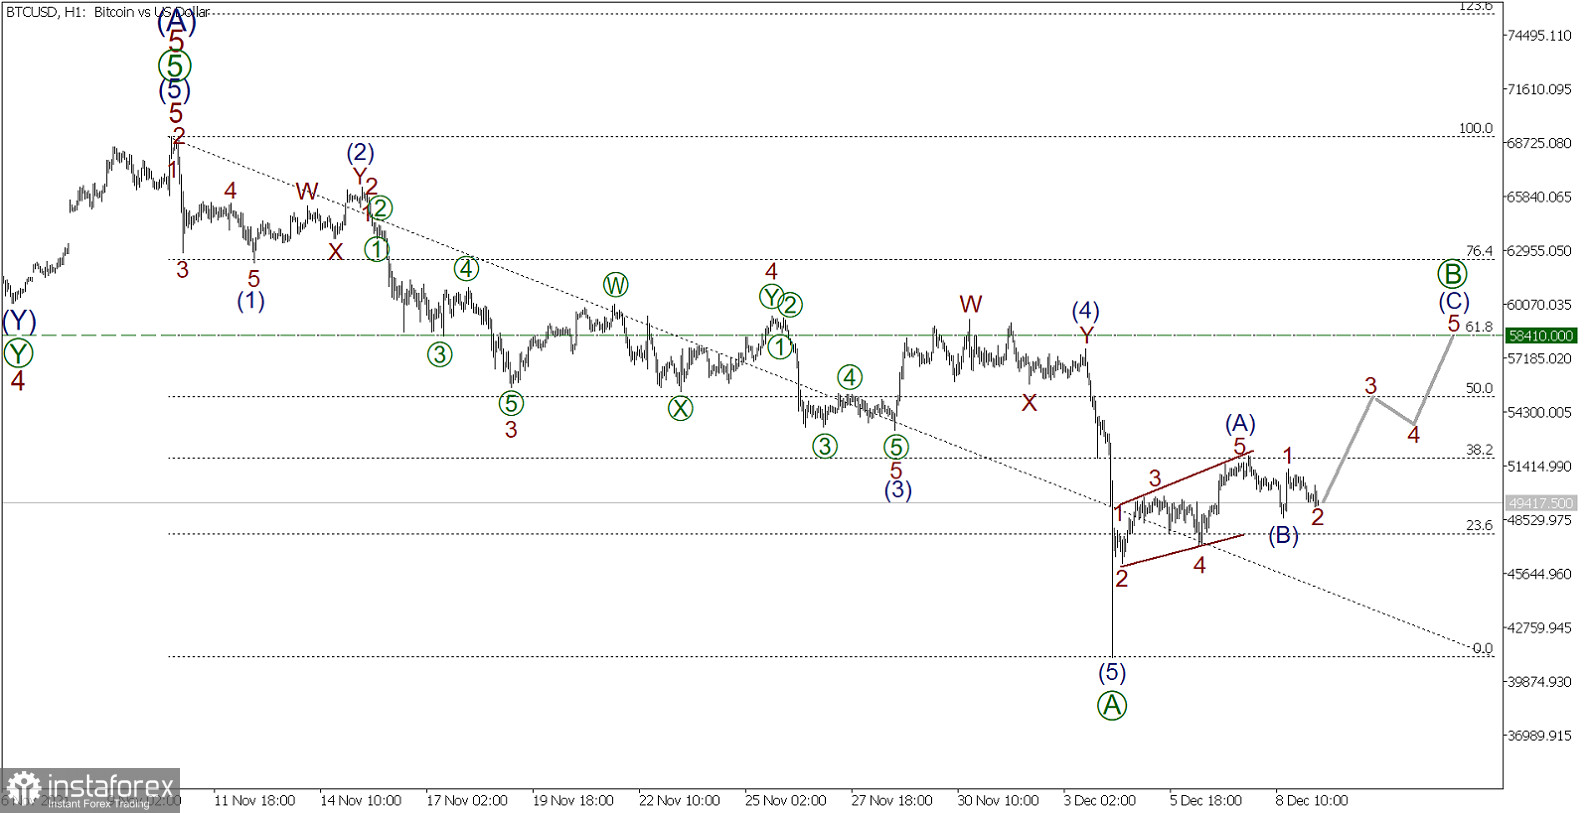
BTC/USD, H1 timeframe:

The first half of a downward simple zigzag is forming for the BTC/USD pair. Currently, the first part of this zigzag - wave [A] can only be noticed. This wave is an impulse pattern that consists of five sub-waves (1)-(2)-(3)-(4)-(5).
Following the end of the downward impulse [A], two parts of the upward correction [B] were formed – the initial diagonal (A) and the correction (B). Accordingly, growth in the final wave (C) should be expected in the near future. It can take the form of a 1-2-3-4-5 pulse. An approximate scheme of possible future movement is shown on the graph.
The entire correction wave [B] can be built to the level of 58410.00. This level is determined using the Fibonacci line tool. At the specified price point, the magnitude of the wave [B] will be 61.8% of the pulse wave [A]. The probability of achieving this coefficient is high.
In this case, an upward price movement is expected in the near future, which means it is worth considering opening buy deals.
Trading recommendation:
It is suggested to buy from the current level, while take profit at 58410.00.


