Here are the details of the economic calendar for December 9, 2021
US data on applications for unemployment benefits came out with a slight decrease in the overall indicator.
Details of statistics:
The volume of initial applications for benefits fell from 227 thousand to 184 thousand.
The volume of repeated applications for benefits increased from 1 954 thousand to 1 992 thousand.
The US dollar reacted extremely reluctantly to the statistics, with a sluggish strengthening.
Analysis of trading charts from December 9
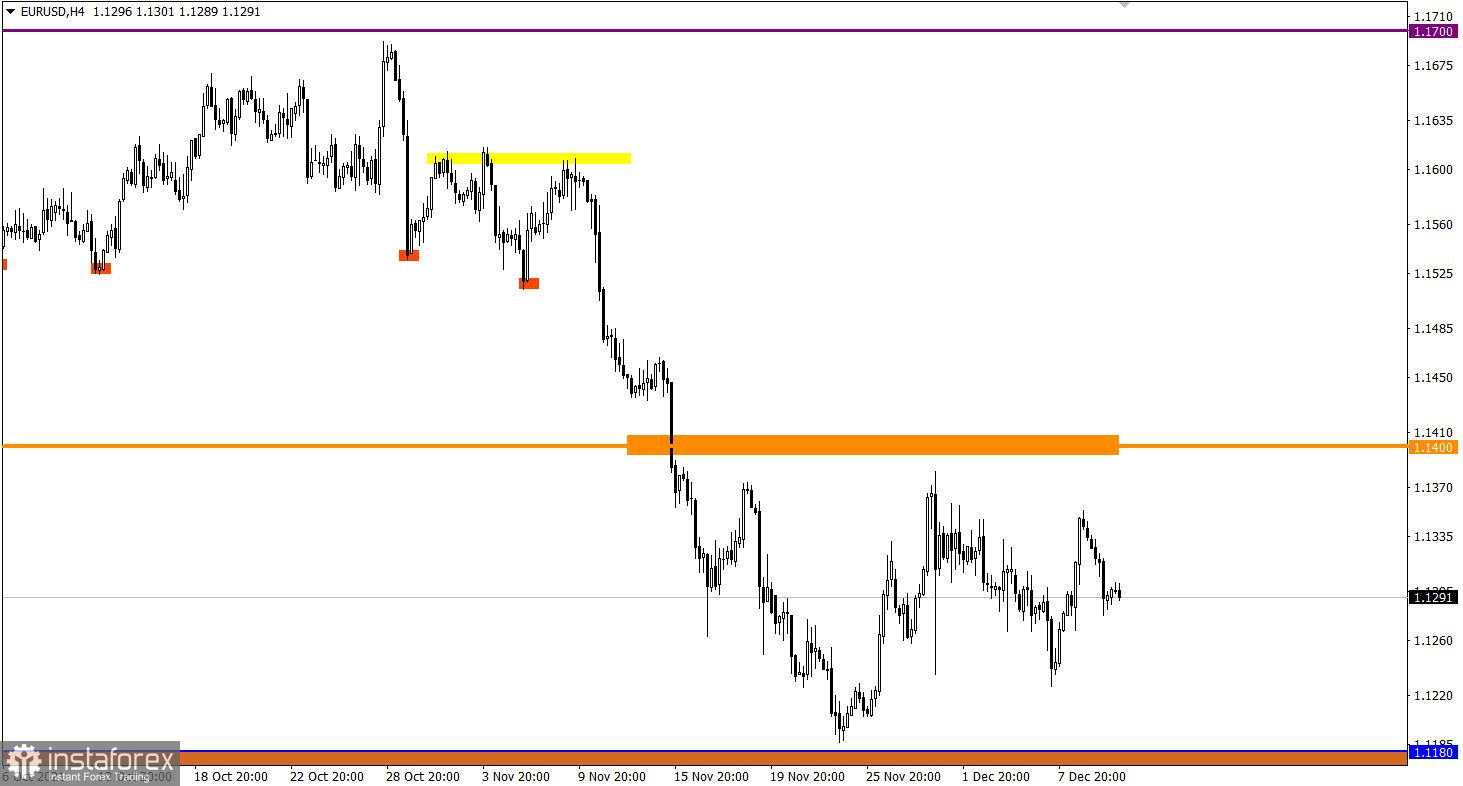
The EURUSD currency pair moved down after the price convergence with the area of the local maximum on November 30. As a result, the quote dropped below 1.1300, where sellers had a chance to resume the downward cycle.
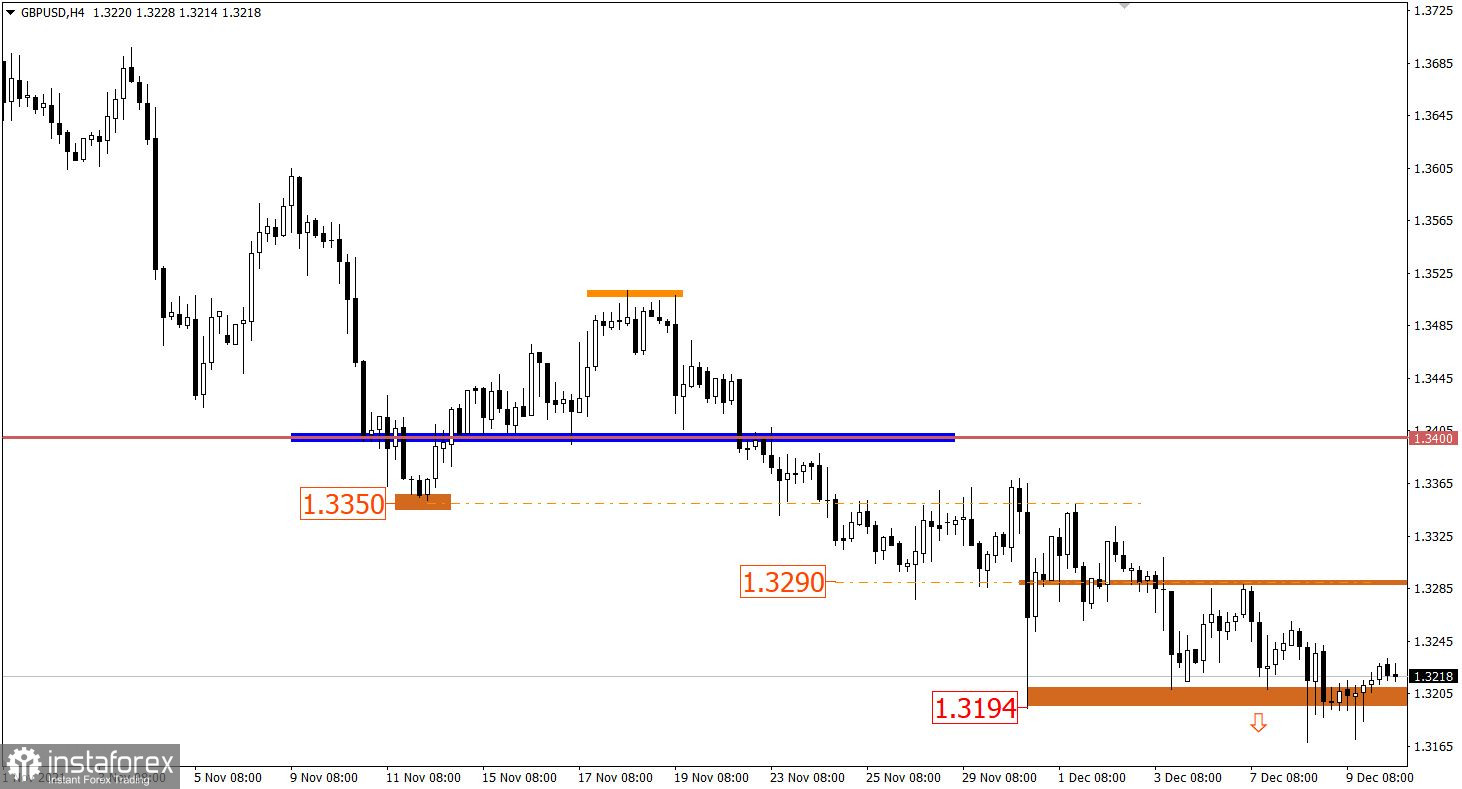
The GBPUSD currency pair has once again updated the local minimum of 2021, but the quotation failed to stay below the new values. As a result, there was a stagnation - a rollback towards the lower border of the previously passed flat 1.3200 / 1.3290.

December 10 economic calendar:
The UK's industrial production was published today at 7:00 Universal time. The growth rate of which slowed down from 2.9% to 1.4% against the forecast of 2.1%.
The data on Britain is bad, but the pound has still reacted to them on a proper scale.
The main event of the day is considered to be the publication of inflation data in the United States. Here, the growth rate of consumer prices should accelerate from 6.2% to 6.9%, which will further convince the market that the Fed will still sharply raise the refinancing rate.
Trading plan for EUR/USD on December 10:
A prolonged price hold below the level of 1.1300 may well lead to an increase in the downward move towards the local low (1.1227) of December 7. This step will lead to a gradual weakening of the euro in the future towards the support area of 1.1160/1.1180.
Traders will consider an alternative scenario of the market development in the event of a change in trading interests. A signal to buy the euro will arise when the price is held above the level of 1.1355.

Trading plan for GBP/USD on December 10:
The sell signal will come from the market when the price is kept below the level of 1.3180 in a four-hour period. In the future, this may lead to a gradual weakening of the pound in the direction of the psychological level of 1.3000.
An alternative scenario considers the resumption of movement within the borders of the side channel of 1.3200/1.3290.
What is reflected in the trading charts?
A candlestick chart view is graphical rectangles of white and black light, with sticks on top and bottom. When analyzing each candle in detail, you will see its characteristics of a relative period: the opening price, closing price, and maximum and minimum prices.
Horizontal levels are price coordinates, relative to which a stop or a price reversal may occur. These levels are called support and resistance in the market.
Circles and rectangles are highlighted examples where the price of the story unfolded. This color selection indicates horizontal lines that may put pressure on the quote in the future.
The up/down arrows are the reference points of the possible price direction in the future.


