Hello, dear colleagues!
Today, on the last day of the weekly trading, let's focus entirely on the AUD/USD currency pair price charts and try to forecast the future direction of this trading instrument. The current trading day has not ended yet. However, to provide a complete picture, let's start our technical analysis from the weekly timeframe.
Weekly

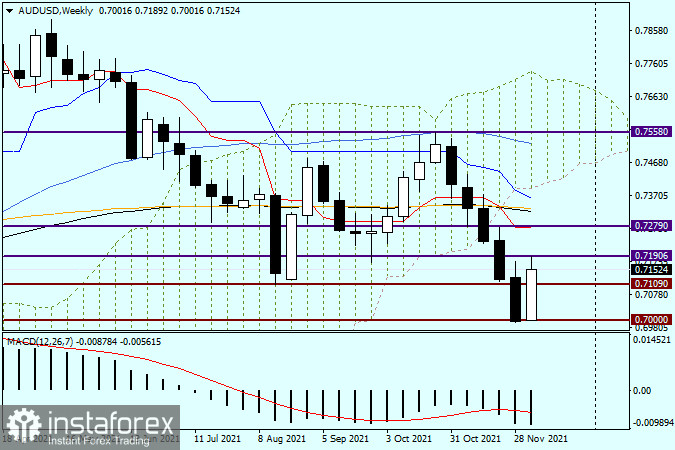
As estimated before, the descending trend completed near the significant, historical and psychological level 0.7000. The pair found a strong and expected support and started to recover its earlier losses. I believe both the closing price of the weekly trading and the size of the upper shadow of the current weekly candlestick will be of crucial significance. Evidently, climbing another significant technical level, 0.7200, the quote has encountered a strong resistance from sellers and is rebounding from this level. If bulls are able to surge upward, and they manage to close the weekly trading above 0.7200, a further strengthening of the Australian dollar versus the US dollar is possible. In case the current weekly candlestick has a big upper shadow, it may indicate a bullish weakness concerning the aussie and it might be a signal for the pair's reversal for further south movement.
Daily

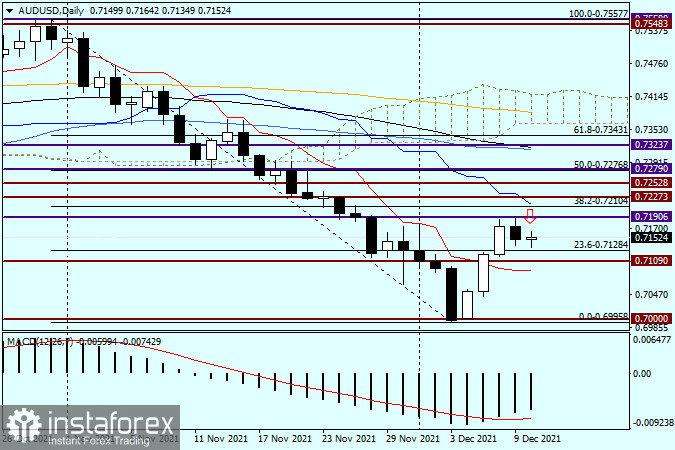
On the daily chart, a downtrend is clearly observed. Besides, the pair has already made a corrective pullback to it. According to the Fibonacci instrument grid, which is stretched to 0.7557-0.6995, the correctional pullback is obviously completed at 0.7190 at the moment of writing this article, i.e. between two pullback levels, 23.6 and 38.2 Fibo. Yesterday's bearish candlestick can be interpreted as a reversal signal to decline. However, today's trading results will determine whether the market will follow it or not. Currently, the swing is observed and the pair AUD/USD is trading near the opening price of today's trades, having already left the upper and lower shadows, which are not too significant so far.
As for the trading recommendations, both buying and selling are beneficial in the current situation. I recommend opening long positions after the pair's decline to the area of 0.7140-0.7130 and appearance of proper candlestick signals at smaller timeframes. Selling may become relevant and profitable in case of reversal candlestick patterns at the price area of 0.7180-0.7200 on the hourly and (or) 4-hour chart. That is all for today. This currency pair is likely to be further analyzed on Monday. Taking into account the weekly trading close and the formed candlestick, it will be possible to give further outlooks for AUD/USD.
Have a nice weekend!


