


Analysis of previous deals:
30M chart of the GBP/USD pair
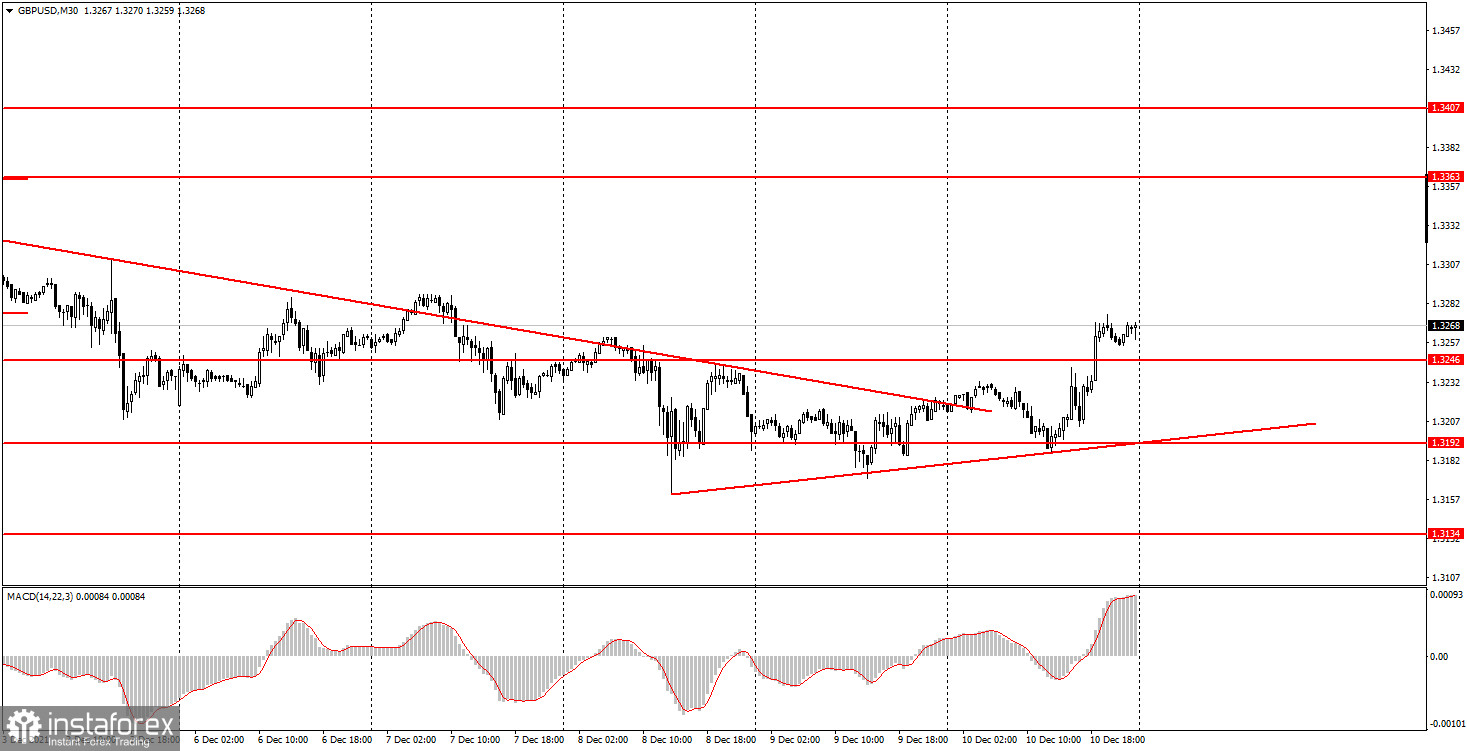
The GBP/USD pair also resumed a not too strong upward movement on Friday. An upward trend line has been formed, which already has as many as three pivot points, therefore it is relatively strong, in contrast to the upward movement itself. Nevertheless, we have repeatedly noted in our articles that the euro and the pound are now appreciating with obvious difficulty, so it should not be surprising that the upward movement is weak. On Friday, in addition to the US inflation report, about which a lot has already been said, quite interesting reports were also published in the UK. In particular, changes in GDP in October and changes in industrial production in the same month. Both of these reports, if not failures, turned out to be significantly worse than forecasts. Therefore, the fall of the British currency in the first half of the day was quite logical. But the fall of the dollar in the second half of the day was not logical, but this is how the markets reacted to the US inflation, which has already accelerated to 6.8%.
5M chart of the GBP/USD pair
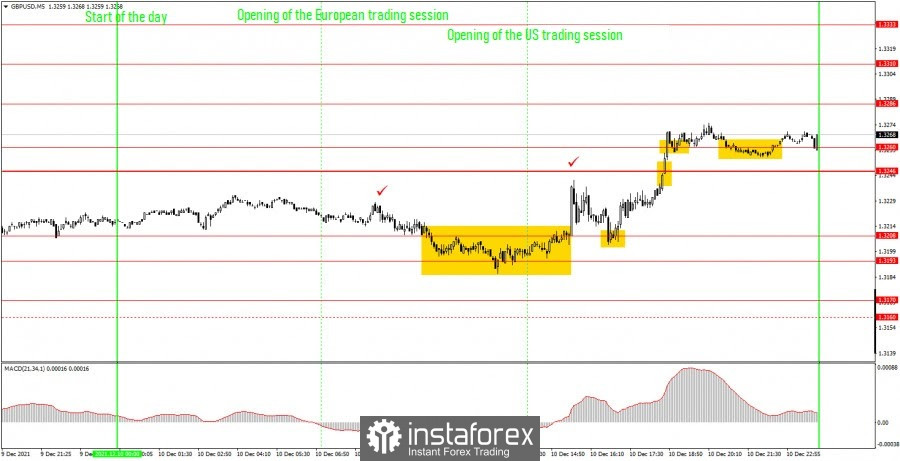
On the 5-minute timeframe, the movement of the pound/dollar pair was quite interesting on Friday. It should be noted right away that the 1.3193-1.3208 area, which was relevant in trading on Thursday, continued to influence the pair's movement on Friday. For example, the first buy signal was formed in this area for several hours. It all ended with the pair rushing up sharply, but this happened exactly at the time when the US inflation report was published (the second checkmark in the chart). Consequently, this signal clearly should not have been processed. The next signal was formed when the markets had already calmed down a bit. The price bounced off the level of 1.3208, forming a new buy signal, which should have been worked out with a long position. The price subsequently continued to rise and broke through the levels of 1.3246 and 1.3260, going up a total of at least 40 points. Therefore, the deal could be closed by Take Profit, and manually in the late afternoon. In any case, profit.
How to trade on Monday:
At this time, an upward trend has formed on the 30-minute timeframe, so the British pound may continue to rise in price in the coming days. This week there will be quite important fundamental events, so the mood of the markets may change five times more. The important levels on the 5 minute timeframe are 1.3170, 1.3192, 1.3208, 1.3246, 1.3260, 1.3286 and 1.3310. We recommend trading on them on Monday. The price can bounce off them or overcome them. As before, we set Take Profit at a distance of 40-50 points. At the 5M TF, you can use all the nearest levels as targets, but then you need to take profit, taking into account the strength of the movement. When passing 20 points in the right direction, we recommend setting Stop Loss to breakeven. Bank of England Governor Andrew Bailey will speak in the UK on December 13. The likelihood that this event will provoke a reaction in the markets is low. No more than 20%. There are no other events or reports scheduled for Monday.
Basic rules of the trading system:
1) The signal strength is calculated by the time it took to form the signal (bounce or overcome the level). The less time it took, the stronger the signal.
2) If two or more deals were opened near a certain level based on false signals (which did not trigger Take Profit or the nearest target level), then all subsequent signals from this level should be ignored.
3) In a flat, any pair can form a lot of false signals or not form them at all. But in any case, at the first signs of a flat, it is better to stop trading.
4) Trade deals are opened in the time period between the beginning of the European session and until the middle of the US one, when all deals must be closed manually.
5) On the 30-minute TF, using signals from the MACD indicator, you can trade only if there is good volatility and a trend, which is confirmed by a trend line or a trend channel.
6) If two levels are located too close to each other (from 5 to 15 points), then they should be considered as an area of support or resistance.
On the chart:
Support and Resistance Levels are the Levels that serve as targets when buying or selling the pair. You can place Take Profit near these levels.
Red lines are the channels or trend lines that display the current trend and show in which direction it is better to trade now.
The MACD indicator consists of a histogram and a signal line. When they cross, this is a signal to enter the market. It is recommended to use this indicator in combination with trend lines (channels and trend lines).
Important speeches and reports (always contained in the news calendar) can greatly influence the movement of a currency pair. Therefore, during their exit, it is recommended to trade as carefully as possible or exit the market in order to avoid a sharp price reversal against the previous movement.
Beginners on Forex should remember that not every single trade has to be profitable. The development of a clear strategy and money management are the key to success in trading over a long period of time.


