


To open long positions on EUR/USD, you need:
Several market entry signals were generated last Friday. Let's take a look at the 5 minute chart and see what happened. In my morning forecast, I paid attention to the 1.1287 level and advised you to make decisions on entering the market. As a result of the release of inflation data in Germany, which coincided with economists' forecasts, bulls tried to focus on protecting the support of 1.1287. The formation of a false breakout led to a good signal to open long positions with the expectation of the end of the bear market, but there was no major growth. After a slight upward movement of 12 points, the pressure on the euro returned and the bears managed to break through the area below 1.1287. Unfortunately, we didn't manage to wait for the upward test of the 1.1287 level. However, we managed to achieve a false breakout in the support area at 1.1263. As a result, the growth amounted to more than 50 points. The latest data on inflation in the US led to a small surge in volatility, without forming new points of entry into the market.
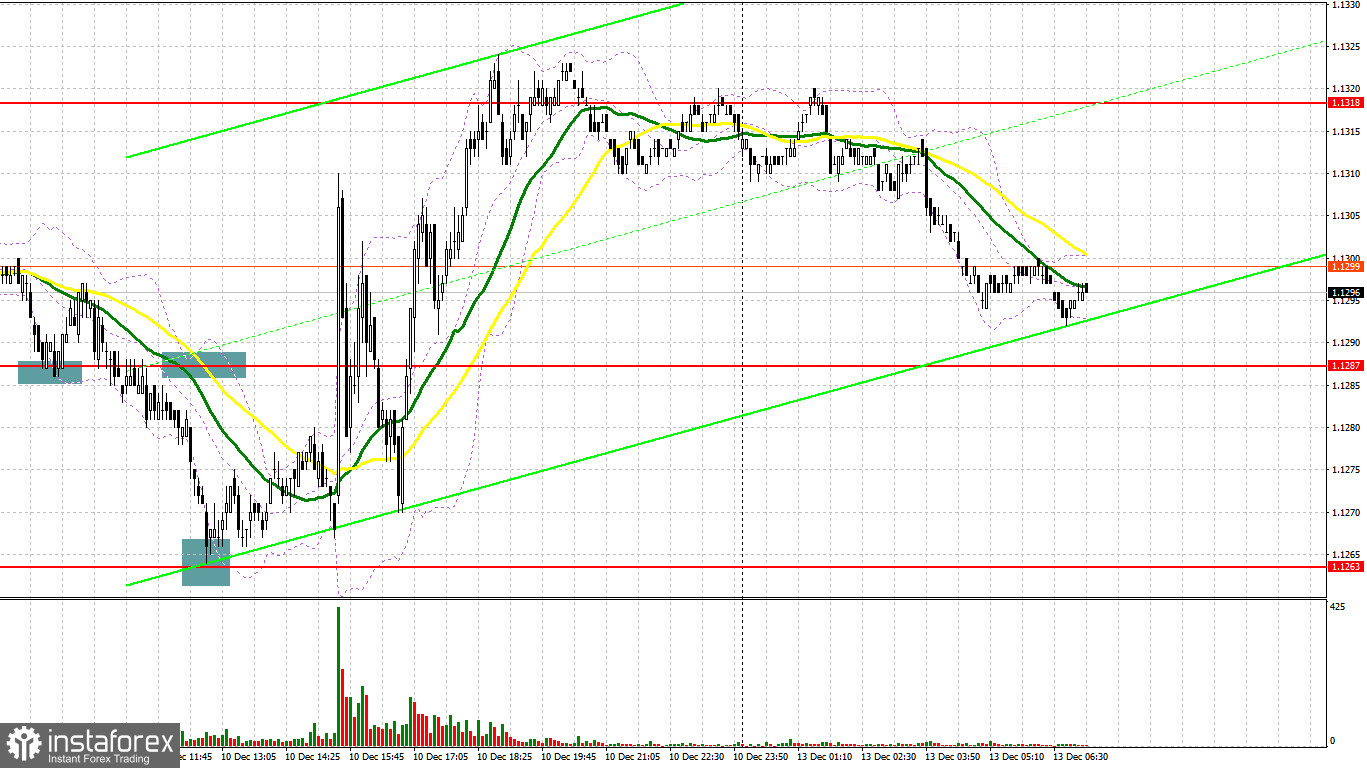
Today we do not have important fundamental statistics, and the data on the German wholesale price index is unlikely to somehow affect the market. The technical picture has also not changed much compared to Friday, so I suggest sticking to the previous scenario. If we observe a return of pressure on the euro in the first half of the day, and while the market is tuned in to this scenario, it is best not to rush into long positions. The optimal entry point will be the formation of a false breakout at 1.1290 with the prospect of a return to the rather important resistance at 1.1318, which we didn't manage to get out of last Friday. The test of this level from top to bottom forms another entry point for buying the euro with an increase to the 1.1353 area. Only the 1.1381 area remains above this level, which is the upper border of the wide horizontal channel - the pair has been in it since November 30. Its breakdown can seriously affect the EUR/USD downward trend, so be very careful at this level. A breakthrough and a downside test of 1.1381 would see a larger advance towards the highs of 1.1415 and 1.1442. The next target will be the 1.1480 level, where I recommend taking profits. If the pair declines during the European session and the bulls are not active at 1.1290, it is best to postpone selling until the larger support at 1.1265. I advise you to buy EUR/USD immediately on a rebound from the 1.1238 low, or even lower - around 1.1214 while aiming for an upward correction of 20-25 points within the day.
To open short positions on EUR/USD, you need:
The bears seize the moment and they enter the market with active attempts to push the euro. The only surprise is why they are not active at the lows around 1.1238. It is possible that someone is gaining a major position before the Federal Reserve meeting. Today, there is nothing to expect from fundamental statistics, so the main task for the first half of the day is to protect 1.1318, just below which there are moving averages playing on the side of the bears. Only the formation of a false breakout there, together with weak data on Germany, will lead to an excellent entry point into short positions, counting on maintaining the pressure on the pair. An equally important challenge for the EUR/USD bears is to regain control of the 1.1290 support they missed last Friday afternoon. A breakdown and a test from the bottom up at 1.1290 will lead to forming a signal to open short positions with the prospect of a decline to the area of 1.1265. The next target will be the 1.1238 level, where I recommend taking profits. If the euro grows and the bears are not active at 1.1318, it is best not to rush to sell. The optimal scenario will be short positions when a false breakout is formed in the 1.1353 area. Selling EUR/USD immediately on a rebound is possible from the highs: 1.1381 and 1.1415 while aiming for a downward correction of 15-20 points.
I recommend for review:
The Commitment of Traders (COT) report for November 30 revealed a decrease in both short and long positions. However, the reduction of long positions still remained higher, which led to an increase in the negative delta. Last week there were a lot of speeches by Federal Reserve Chairman Jerome Powell, who in his comments spoke enough about the expected changes in monetary policy towards its tightening. The reason for this is rather high inflation, which has grown from "temporary" to permanent, which creates many problems for the central bank. The second problem was a new strain of the Omicron coronavirus, which will slow down the global economy at the end of this and early next year, which also restrains the demand for risky assets from bulls. The Fed will hold a meeting next week, at which a decision will be made on the bond purchase program, so demand for the US dollar is expected to remain in the shorter term. The latest November COT report indicated that long non-commercial positions declined from the level of 204,214 to the level of 191,048, while short non-commercial positions fell from the level of 220,666 to the level of 214,288. At the end of the week, the total non-commercial net position increased to -23,240 against -16,452. The weekly closing price, on the contrary, rose much to 1.1292 against 1.1241.
Indicator signals:
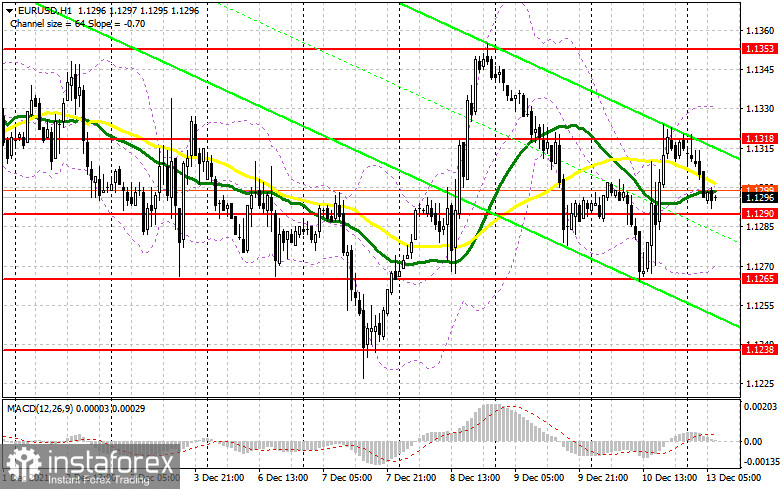
Trading is carried out below the 30 and 50 daily moving averages, which indicates a return of pressure on the euro.
Moving averages
Note: The period and prices of moving averages are considered by the author on the H1 hourly chart and differs from the general definition of the classic daily moving averages on the daily D1 chart.
Bollinger Bands
In case of a decline, support will be provided by the lower border of the indicator in the area of 1.1270. In case of growth, the upper border of the indicator at 1.1325 will act as resistance.
Description of indicators
- Moving average (moving average, determines the current trend by smoothing out volatility and noise). Period 50. It is marked in yellow on the chart.
- Moving average (moving average, determines the current trend by smoothing out volatility and noise). Period 30. It is marked in green on the chart.
- MACD indicator (Moving Average Convergence/Divergence — convergence/divergence of moving averages) Quick EMA period 12. Slow EMA period to 26. SMA period 9
- Bollinger Bands (Bollinger Bands). Period 20
- Non-commercial speculative traders, such as individual traders, hedge funds, and large institutions that use the futures market for speculative purposes and meet certain requirements.
- Long non-commercial positions represent the total long open position of non-commercial traders.
- Short non-commercial positions represent the total short open position of non-commercial traders.
- Total non-commercial net position is the difference between short and long positions of non-commercial traders.


