


Trend analysis
The price from the level of 1.1314 (closing of the last weekly candle) may continue to rise to the target of 1.1387 – the historical resistance level (blue dotted line) this week. If this level is broken upwards, the upward movement will resume to the target of 1.1440 – the pullback level of 23.6% (blue dotted line).
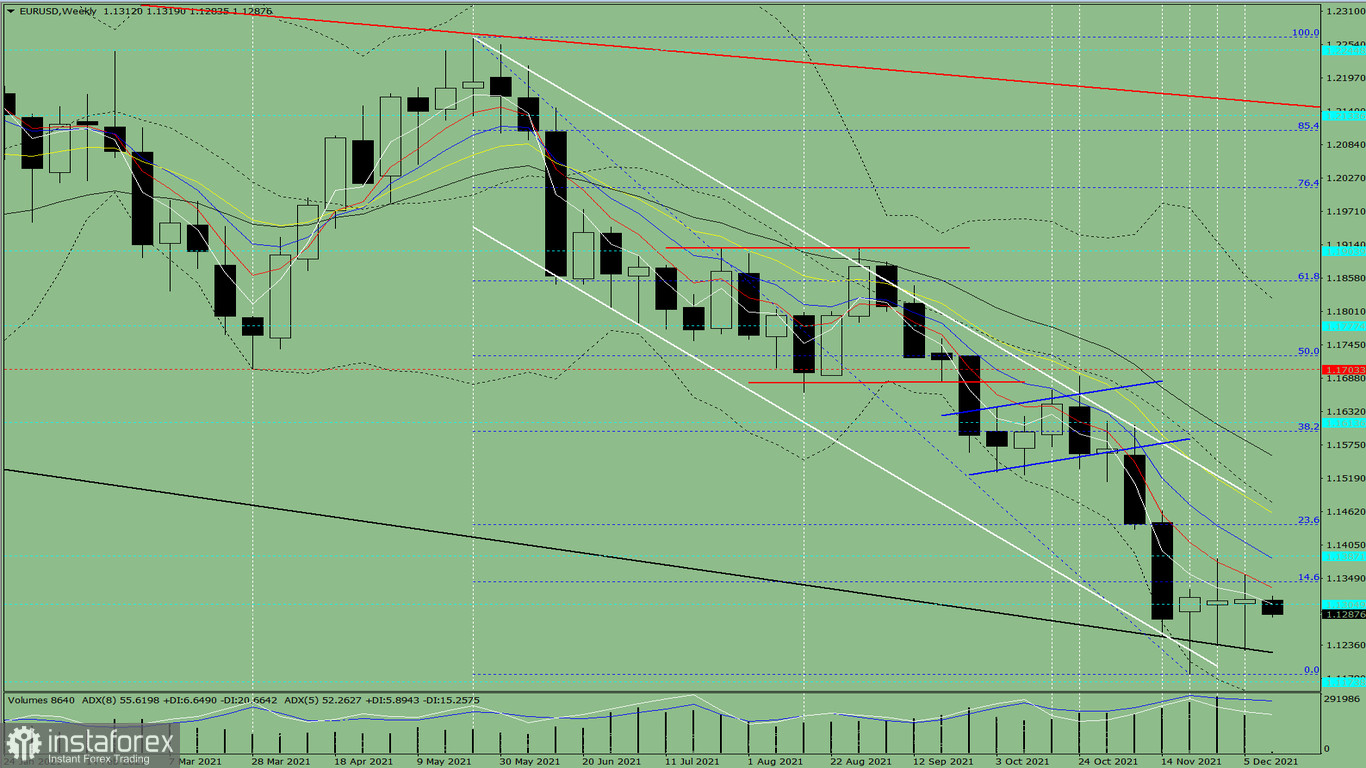
Fig 1 (weekly chart)
Indicator analysis:
- Indicator analysis - up
- Fibonacci levels - up
- Volumes - up
- Candlestick analysis - up
- Trend analysis - up
- Bollinger lines - up
An upward movement can be concluded based on a comprehensive analysis.
The overall result of the candlestick calculation based on the weekly chart: the price will most likely move in an upward trend, both without a lower shadow (Monday - down) and an upper shadow (Friday - up) in the weekly white candlestick.
This week, the price from the level of 1.1314 (closing of the last weekly candle) is likely to increase to the target of 1.1387 – the historical resistance level (blue dotted line). In the event that this level is broken upwards, it may further rise to the target of 1.1440 – the pullback level of 23.6% (blue dotted line).
Alternatively, the price from the level of 1.1314 (closing of the last weekly candle) may start declining with the goal of testing the lower fractal of 1.1186 (blue dashed line). After reaching this line, the upward movement may continue to the target of 1.1343 – the pullback level of 14.6% (blue dotted line).


