


Analysis of previous deals:
30M chart of the EUR/USD pair
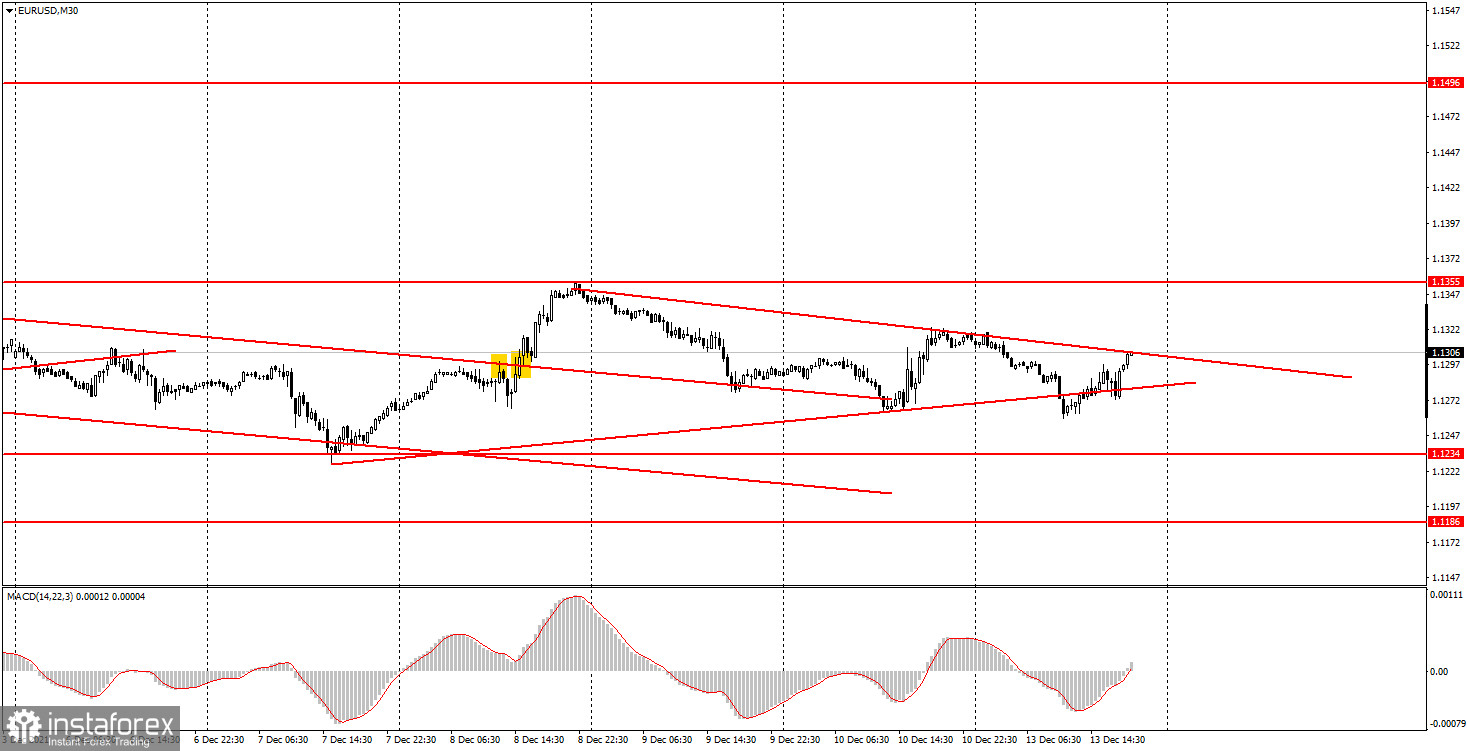
The EUR/USD pair resumed the upward movement on Monday after another round of downward correction. However, the pair managed to settle briefly below the upward trend line. And besides that, a downward trend line was also formed. As weak as growth. In general, all of the pair's movements are now very weak. Thus, all tendencies or trend lines are rather arbitrary. No important macroeconomic or fundamental event in America or the European Union on Monday. Novice traders had nothing to react to during the day. Although the volatility of the pair today amounted to about 60 points, the overall movement was still weak. Especially during the day, not at night. Thus, the pair will continue to try its best to continue moving upwards, which indicates the euro's growth. But it is already clear that bulls are now very weak, so the euro has few chances of growth. Perhaps something will change on Wednesday or Thursday, after the meetings of the Federal Reserve and the European Central Bank.
5M chart of the EUR/USD pair
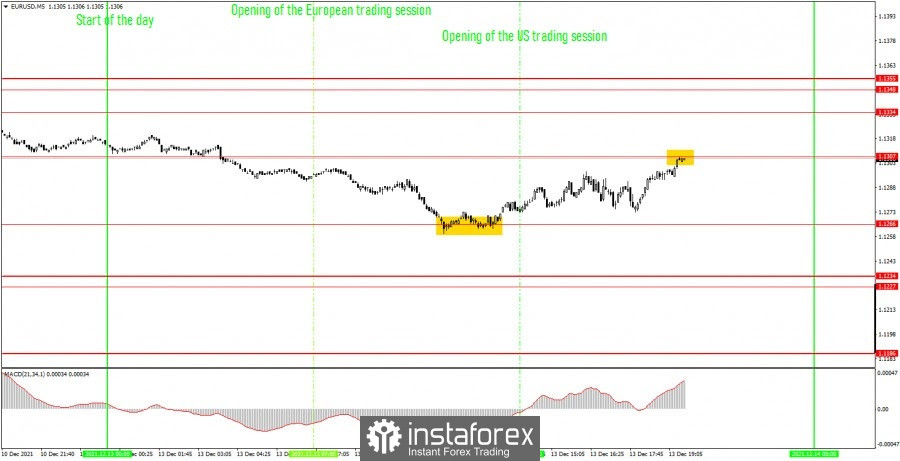
On the 5-minute timeframe, the picture was contradictory on Monday. On the one hand, the movement in the first half of the day was trending, downward trend, in the second - trending, upward, and only one trading signal was generated. It would seem that it is much easier. But this single signal caused a large number of questions. Now we will analyze it. A buy signal was formed after a rebound from the level of 1.1266. Subsequently, in the second half of the US session, the pair reached the target level of 1.1307. Thus, the profit on a long position could be 27 points. But in the middle of this upward movement, a downward pullback followed, due to which the pair dropped almost to the level of opening a long position. And since before this downward movement the pair managed to go up 15 points, a Stop Loss order should have been placed on a long position at breakeven. Therefore, depending on whether it was placed or not, and where exactly it was placed, novice traders made a profit on a single deal of the day or not. A sell signal in the form of a rebound from the level of 1.1307 should not have been rejected, as it was formed too late.
How to trade on Tuesday:
On the 30-minute timeframe, a new downtrend line has formed, while the upward trend has been canceled. However, the strength of the new trendline is the same as the previous one. In the next few hours, the pair may settle above the new trend line, which, it turns out, will mean the cancellation of the upward trend. Therefore, the main thing that should be understood now is that the movements are weak, the trends are weak. On the 5-minute timeframe, the key levels for December 14 are 1.1186, 1.1227 - 1.1234, 1.1266, 1.1307, 1.1344, 1.1348-1.1355. Take Profit, as before, is set at a distance of 30-40 points. Stop Loss - to breakeven when the price passes in the right direction by 15 points. At the 5M TF, the target can be the nearest level if it is not too close or too far away. If it is, then you should act according to the situation or work according to Take Profit. No important statistics planned either in the European Union or in the United States on Tuesday. Thus, the volatility is likely to be low again tomorrow.
Basic rules of the trading system:
1) The signal strength is calculated by the time it took to form the signal (bounce or overcome the level). The less time it took, the stronger the signal.
2) If two or more deals were opened near a certain level based on false signals (which did not trigger Take Profit or the nearest target level), then all subsequent signals from this level should be ignored.
3) In a flat, any pair can form a lot of false signals or not form them at all. But in any case, at the first signs of a flat, it is better to stop trading.
4) Trade deals are opened in the time period between the beginning of the European session and until the middle of the American one, when all deals must be closed manually.
5) On the 30-minute TF, using signals from the MACD indicator, you can trade only if there is good volatility and a trend, which is confirmed by a trend line or a trend channel.
6) If two levels are located too close to each other (from 5 to 15 points), then they should be considered as an area of support or resistance.
On the chart:
Support and Resistance Levels are the Levels that serve as targets when buying or selling the pair. You can place Take Profit near these levels.
Red lines are the channels or trend lines that display the current trend and show in which direction it is better to trade now.
The MACD indicator (14,22,3) consists of a histogram and a signal line. When they cross, this is a signal to enter the market. It is recommended to use this indicator in combination with trend lines (channels and trend lines).
Important speeches and reports (always contained in the news calendar) can greatly influence the movement of a currency pair. Therefore, during their exit, it is recommended to trade as carefully as possible or exit the market in order to avoid a sharp price reversal against the previous movement.
Beginners on Forex should remember that not every single trade has to be profitable. The development of a clear strategy and money management are the key to success in trading over a long period of time.


