


To open long positions on EUR/USD, you need:
A fairly large number of signals to enter the market were formed yesterday. Let's take a look at the 5-minute chart and figure out the entry points. Even in my morning forecast, I drew attention to the 1.1290 level and advised you to make decisions on entering the market. In the absence of important fundamental statistics on the eurozone and strong Friday data on inflation in the US, the pressure on the euro is expected to return. A breakthrough and consolidation below the level of 1.1290 led to forming a signal to sell the euro and to a more active decline towards the lower border of the 1.1265 channel, where I recommended taking profits. Towards the afternoon, the bulls achieved a false breakout at 1.1265 and protected this range, which led to a signal to open long positions. The growth was around 30 points. However, the bears were also not going to stand aside and again showed their position at the level of 1.1290. By analogy with the first half of the day, a false breakout led to a signal to sell the euro, but the downward movement was about 15 points.
Before we talk about the future prospects of the EUR/USD movement, let's look at what happened in the futures market and how the positions of Commitment of Traders have changed. The Commitment of Traders (COT) report for December 7 revealed that short positions decreased and long ones slightly increased, which led to a decrease in the negative delta value. Many traders have been preparing for the central bank meetings this week. Very serious changes are expected in the monetary policy of the Federal Reserve, as well as the European Central Bank. The inflation data is forcing the management to act more aggressively, but knowing which path it will take is rather difficult. Last week, there were several speeches by Fed Chairman Jerome Powell, who in his comments talked enough about the expected changes in monetary policy towards tightening. The Omicron coronavirus strain is also keeping Europeans and Americans awake, dampening demand for risky assets amid uncertainty over the ECB's future policy. The latest November COT report indicated that long non-commercial positions rose from 191,048 to 194,869, while short non-commercials fell from 214,288 to 203,168. important events in the conditions of the formed horizontal channel. At the end of the week, the total non-commercial net position decreased its negative value from -23,240 to -8,299. The weekly closing price, on the contrary, did not change due to the horizontal channel - 1.1283 against 1.1292.
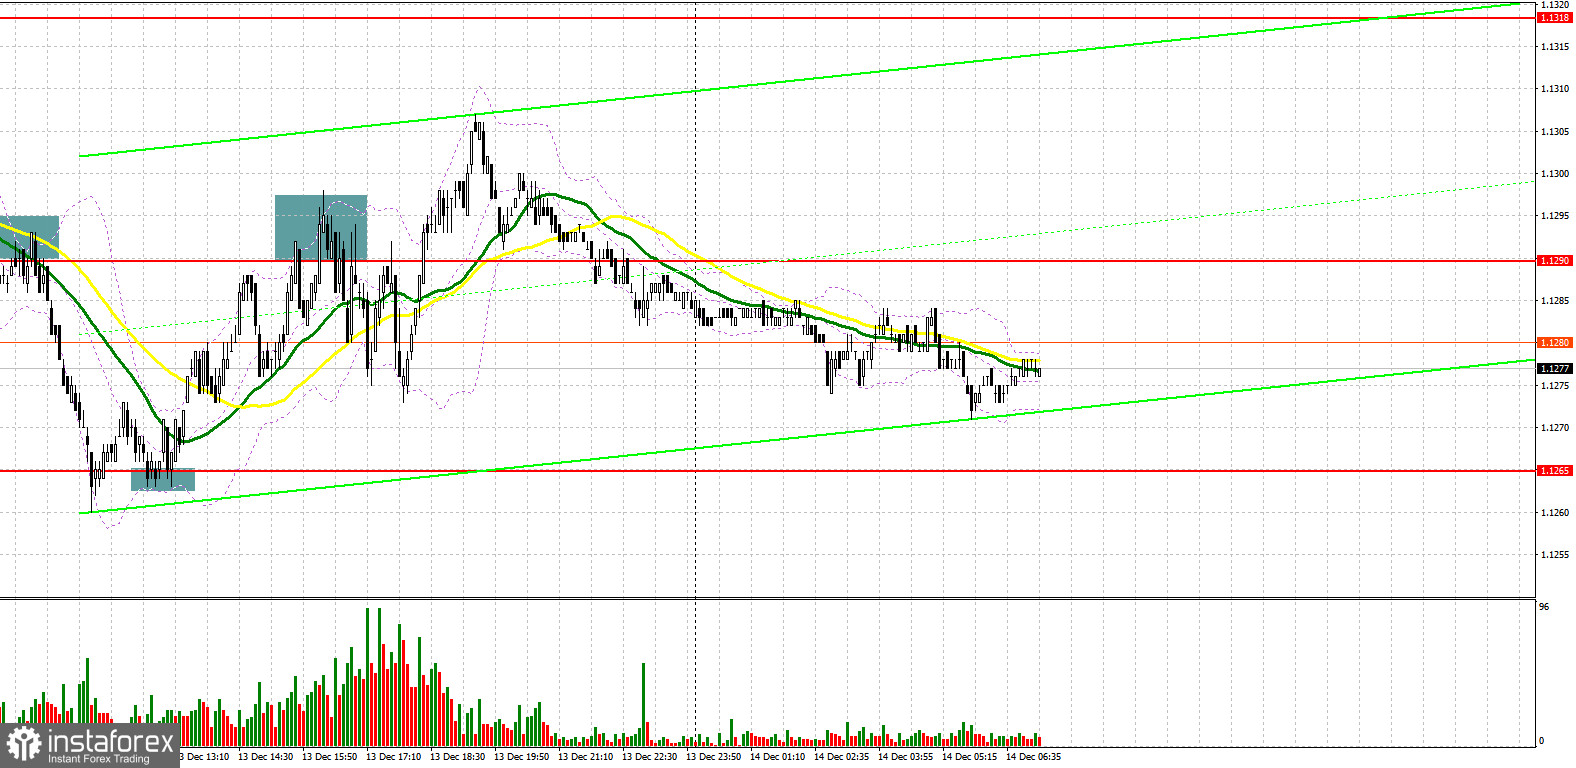
The technical picture has not changed much compared to yesterday. Trading continues within the horizontal channel, however, the bears have the advantage. In case the euro falls in the first half of the day, only the formation of a false breakout at the level of 1.1265 will lead to forming a good entry point into long positions. But, besides this, an active upward movement of the pair is necessary. This may be helped by data on changes in industrial production in the eurozone, since no other reports are planned for the first half of the day. Only a very serious growth in the indicator will return the demand for risky assets. If the bulls can not offer anything when the 1.1265 level is tested, then it is better not to rush with long positions. Surpassing the channel's lower border could lead to a larger sell-off in the euro. In this case, I advise you to buy EUR/USD only after the next update of support at 1.1238, and then, subject to the formation of a false breakout there. It is possible to immediately open long positions on a rebound from the low around 1.1214 while aiming for an upward correction of 20-25 points within the day. An equally important task for the bulls is to return to the level of 1.1291, just below which are the moving averages playing on the side of the bears. A breakthrough and consolidation above this range will surely bring back risk appetite, which will form an excellent entry point into long positions in order to update the immediate resistance of 1.1318. Going beyond this range can seriously affect the EUR/USD downward trend, so be very careful at this level. A breakthrough and a downside test of 1.1318 would see a larger rally towards the highs of 1.1353 and 1.1381. The next target will be the 1.1415 level, where I recommend taking profits.
To open short positions on EUR/USD, you need:
The bears control the market, and the Fed meeting only increases the demand for safe-haven assets. The best scenario for selling the euro in the first half of the day is the 1.1291 level to be tested. Forming a false breakout there creates an excellent entry point into short positions with the prospect of a collapse to the support area of 1.1265, which we did not manage to get below yesterday. A breakthrough and retest from the bottom up of this range, together with weak data for the eurozone, can create another signal to enter the market, which will push the pair to a significant low like 1.1238. Quite a lot depends on this level, as going beyond the broader horizontal channel from November 30 will determine the medium-term direction of the pair. A breakthrough of 1.1238 would open a straight path to the lows of 1.1214 and 1.1188. If the pair recovers during the European session and bears are not active at the level of 1.1291, the optimal scenario would be to sell when a false breakout is formed around 1.1318. Selling EUR/USD immediately on a rebound is possible from the highs: 1.1353 and 1.1381 while aiming for a downward correction of 15-20 points.
Indicator signals:
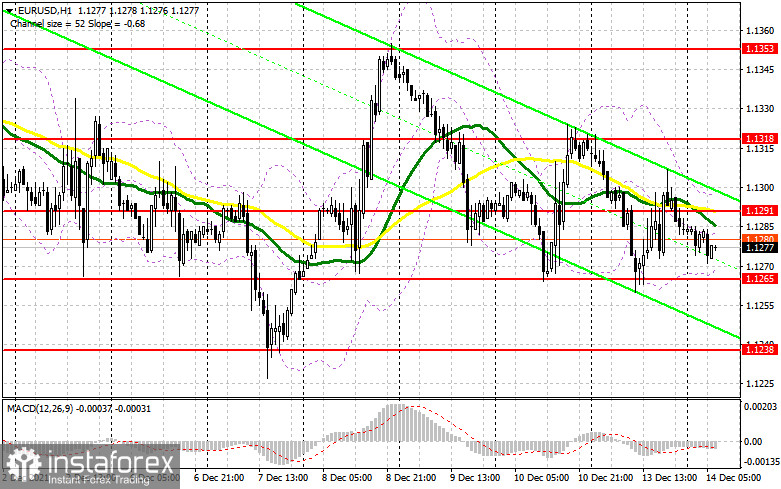
Trading is carried out just below the 30 and 50 moving averages, which indicates an attempt by the bears to continue the pair's decline.
Moving averages
Note: The period and prices of moving averages are considered by the author on the H1 hourly chart and differs from the general definition of the classic daily moving averages on the daily D1 chart.
Bollinger Bands
A breakthrough of the upper border of the indicator in the area of 1.1301 will push the pair to rise. A breakout of the lower border of the indicator in the area of 1.1265 will increase the pressure for the pair.
Description of indicators
- Moving average (moving average, determines the current trend by smoothing out volatility and noise). Period 50. It is marked in yellow on the chart.
- Moving average (moving average, determines the current trend by smoothing out volatility and noise). Period 30. It is marked in green on the chart.
- MACD indicator (Moving Average Convergence/Divergence — convergence/divergence of moving averages) Quick EMA period 12. Slow EMA period to 26. SMA period 9
- Bollinger Bands (Bollinger Bands). Period 20
- Non-commercial speculative traders, such as individual traders, hedge funds, and large institutions that use the futures market for speculative purposes and meet certain requirements.
- Long non-commercial positions represent the total long open position of non-commercial traders.
- Short non-commercial positions represent the total short open position of non-commercial traders.
- Total non-commercial net position is the difference between short and long positions of non-commercial traders.


