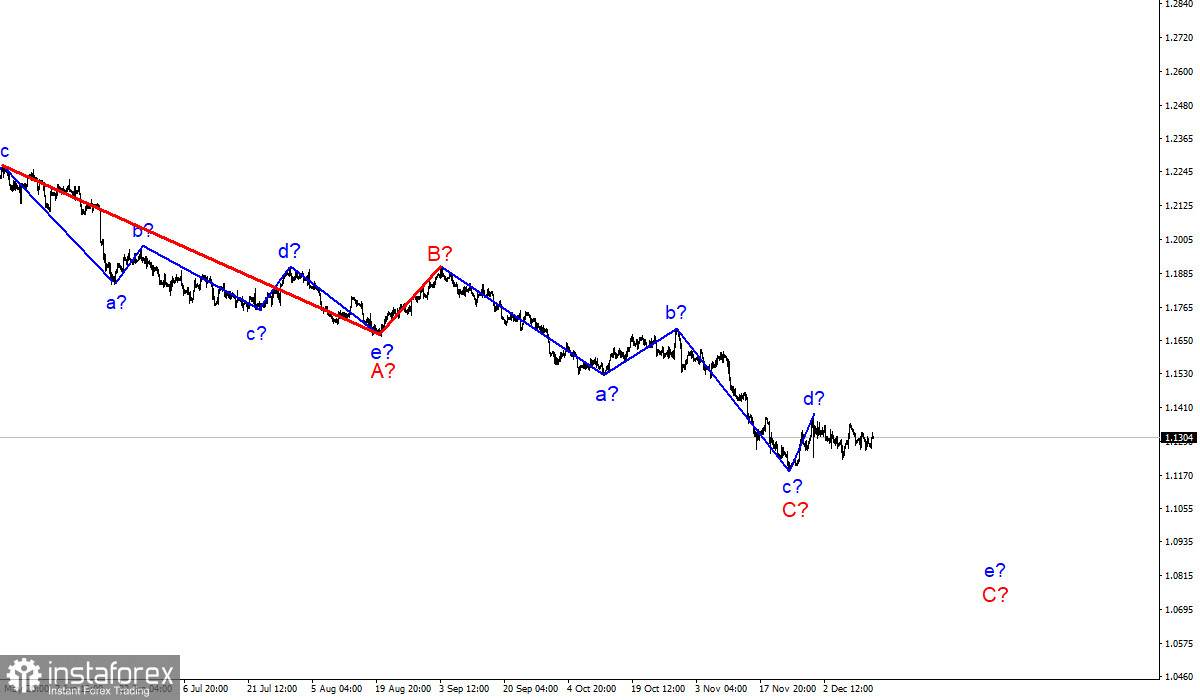
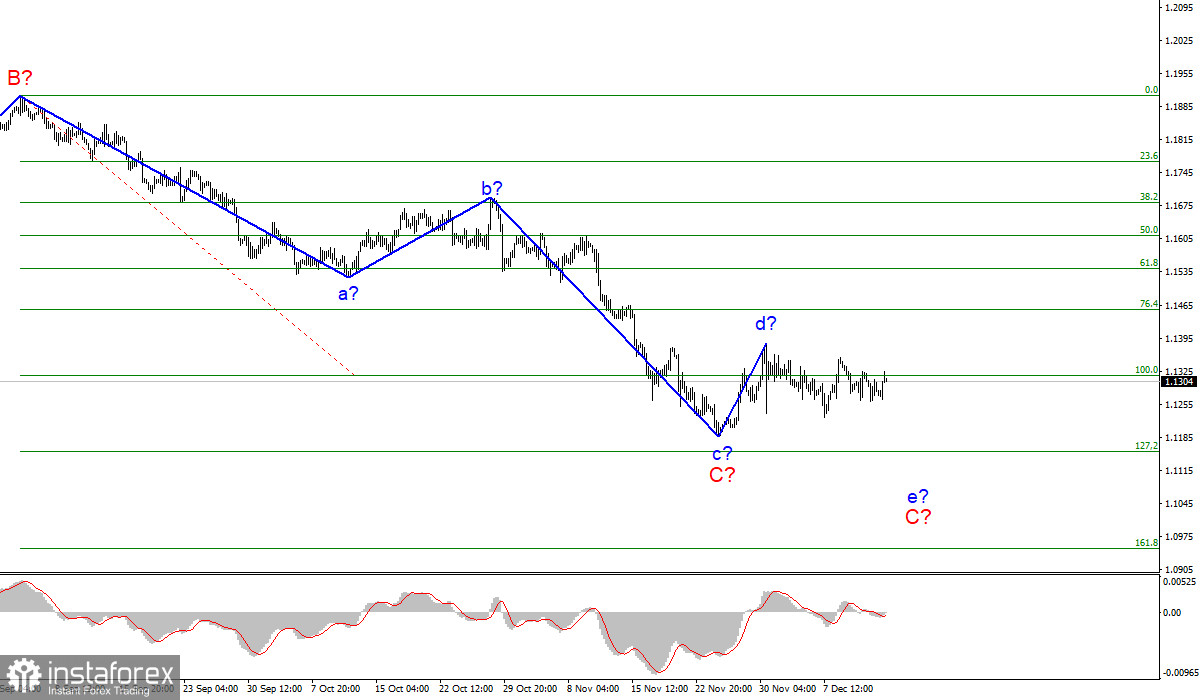
Wave pattern
The wave layout for EUR/USD on the 4-hour chart remains complete and does not require any changes. Currently, the C wave continues its formation and it is likely to take a five-wave structure. At the moment, the construction of an ascending wave d in C has probably come to an end. If the current layout is correct, an internal wave e in C is being built. A successful attempt to break through the 100.0% Fibonacci level will indicate that the market is ready to go short on the instrument. So, the pair may continue to fall throughout the week towards the estimated target of 1.1152 which corresponds to the 127.2% Fibonacci retracement where the entire trend section can complete its formation. I would like to highlight that the C wave is taking a corrective form. So, the entire descending section of the trend, which originated in January 2021, may take a five-wave A-B-C-D-E form instead of a three-wave structure. It will be possible to give a more precise forecast when the C wave completes its formation.
Markets in risk-off mood ahead of ECB and Fed meetings
The news background for EUR/USD was weak on Tuesday. The report on industrial production in the eurozone for October showed that the indicator increased by 1.1% on a monthly basis and by 3.3% on a yearly basis. The first reading was well below market expectations while the second one was only a bit lower than expected. Markets seemed to be not so interested in this report. Yet, the pair began to rise right after its release and at the time of writing, it moved up by 56 basis points. However, I don't even remember the last time when the pair moved by 50-60 pips in response to the data on industrial production, especially when the actual reading almost came in line with the forecast. Therefore, I believe this was just a coincidence. If you look at the chart with higher resolution, you can clearly see that in the last three days the fluctuation range of the pair was within 30 pips. The pair has been stuck in the range between 1.1265 and 1.1325. As I see it, markets are not going to take any action on the pair until tomorrow night or at least until the North American session when the results of the Fed meeting will be announced. Markets expect the Fed to cut the QE program by $30 billion. Jerome Powell will announce the exact decision at the press conference. Based on the current wave layout, the further decline of EUR/USD seems quite predictable. The downtrend should be supported by strong statements and decisions from the FOMC.
Conclusion
Based on the analysis above, I can conclude that the formation of the descending wave C is likely to be completed. However, the internal structure of the assumed wave d suggests that another descending wave e may start to form soon. Thus, I advise selling the pair with the targets around 1.1152 for every sell signal of the MACD indicator.

Higher time frame
The wave layout on the higher time frame looks quite convincing. The quotes continue to move lower. The descending section of the trend that was initiated on May 25 takes the form of a three-wave correctional pattern A-B-C. This means that the downtrend may continue for several more weeks until the C wave is fully formed. It should take a five-wave structure in this case.


