


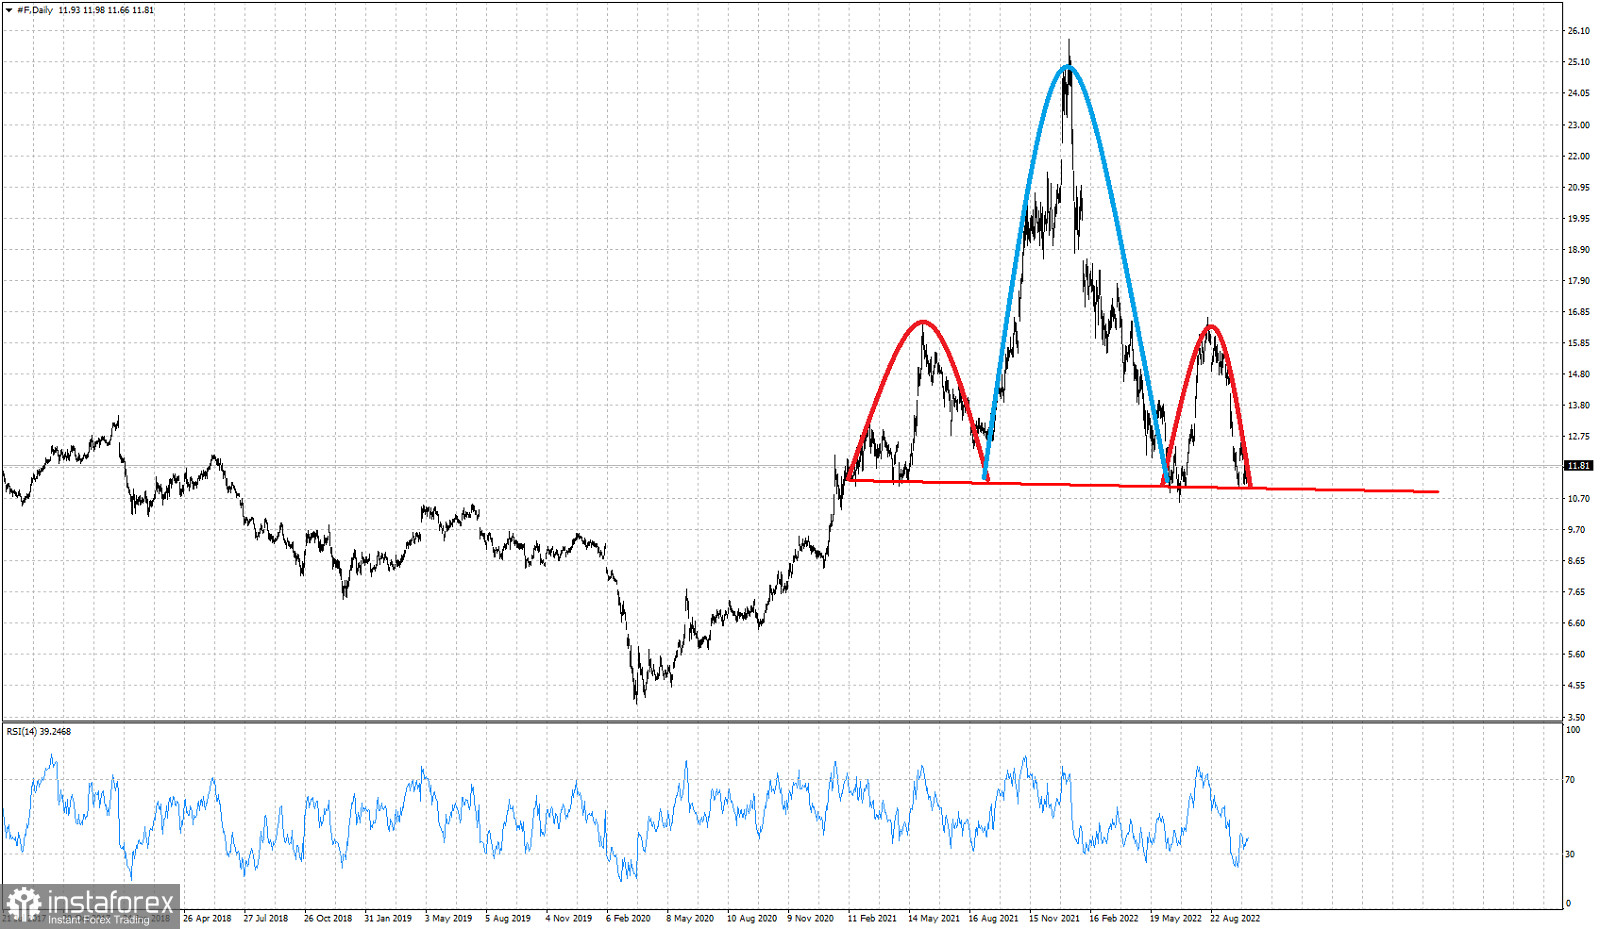
Red line- neckline support
Blue line- Head
Red curved lines- Shoulders
Ford stock price is at $11.81 after a multi month decline from $25.85. This is not the first time price has reached the $12-$11 zone. Price was here in June-July, then a bounce towards $16.70 followed. Zooming out we observe a multiweek head and shoulders pattern with price challenging the neckline support. Price is now at very important support and the RSI turning upwards from oversold levels. Despite being a bearish pattern, it can also be used by bulls. Opening long positions with stops at the neckline support would be a strategy used by aggressive traders. The right hand shoulder high at $16.67 if broken, it will cancel the bearish scenario of the Head and shoulders pattern. A weekly break below $11 would be a bearish sign.


