


EUR/USD 24-hour TF analysis.
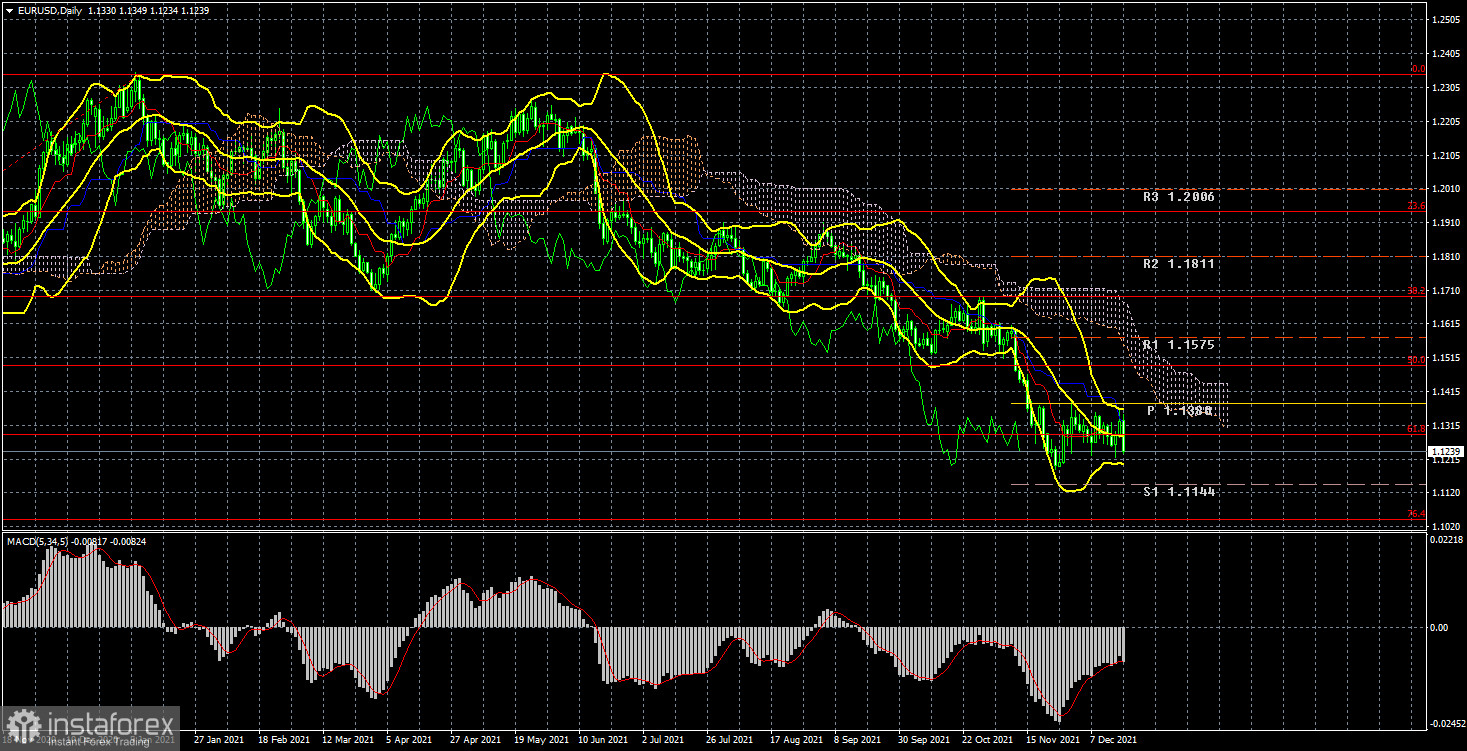
The EUR/USD currency pair has fallen by 75 points during the current week. However, in general, it is visible that the pair has been trading inside a rather narrow side channel for several weeks. The illustration above shows that the quotes are still located near their annual lows, and there are no signs of the end of the downward trend. Thus, after the next trading week, it is impossible to draw any conclusions about the change in the technical picture. The European currency and bulls were probably counting on the meetings of the ECB and the Fed. However, what could be expected from these central banks in terms of supporting the European currency? Even before the announcement of the results, it was clear that the ECB would take a wait-and-see attitude, if not passive. This has been repeated by Christine Lagarde over the past months. The Fed, in turn, was simply obliged to accelerate the pace of asset purchases, which is a "hawkish" decision. However, the ECB also announced that it would curtail its PEPP program in March 2022 (as well as the Fed - QE). Consequently, it can even be concluded that the decisions taken by the two central banks were similar. The only difference not in favor of the euro currency is the expansion of the standard APP incentive program when the emergency PEPP is completed. Thus, we can say that the Fed won, but with a minimum score and due to a penalty kick in the 90th minute. The markets reacted to both meetings with purchases of the pair. However, as it turned out on Friday, the purchases were not strong and short-lived. It was on December 17 that the pair had already collapsed down 100 points as if playing back the results of the Fed and ECB meeting with a delay. Thus, in general, the week ended quite logically.
Analysis of the COT report.
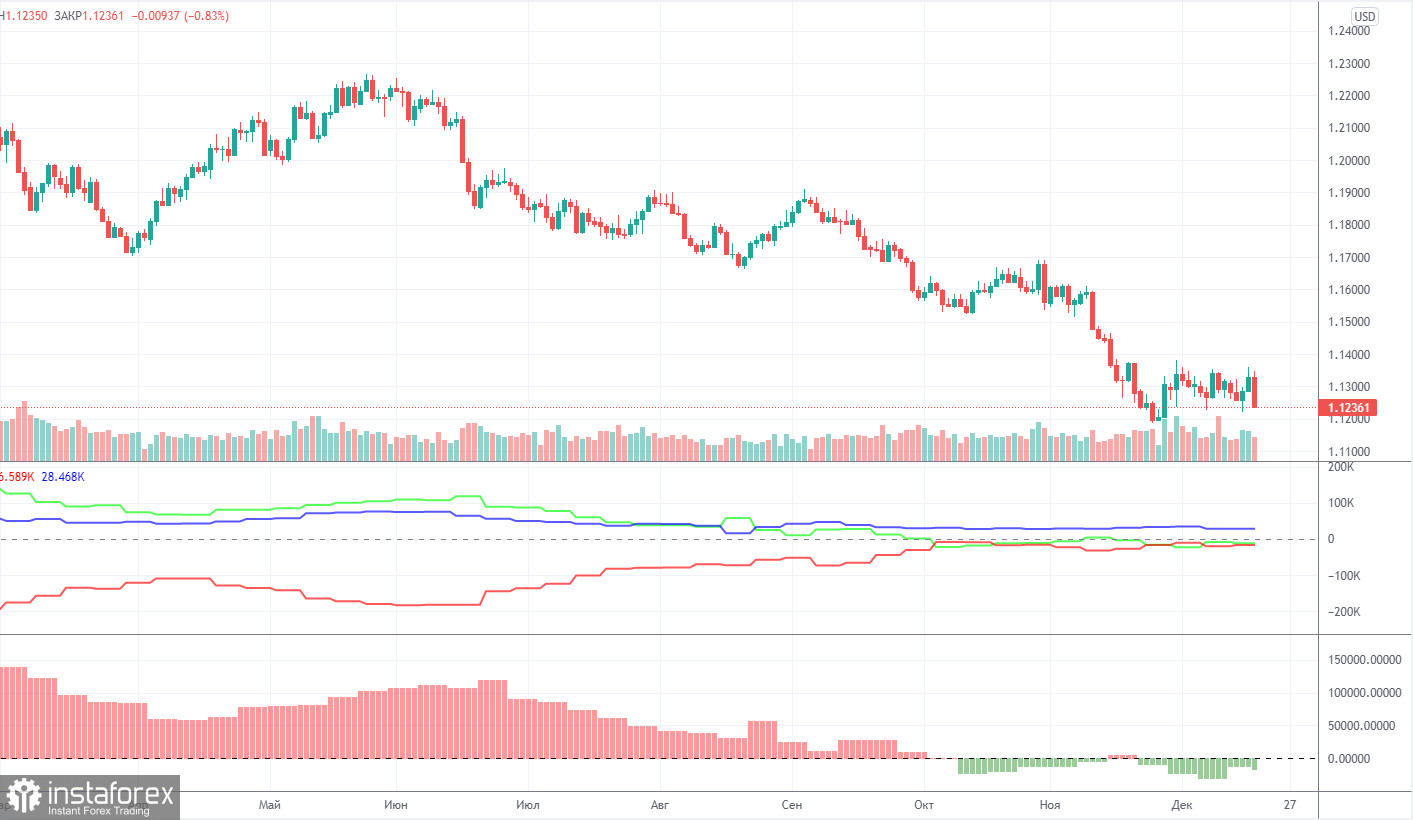
During the last reporting week (December 7-13), the mood of non–commercial traders has become a little more "bearish". The "Non-commercial" group of traders now has more short positions than long ones, but this advantage is minimal. The difference is only 18 thousand contracts, which is not so much. During the reporting week, professional traders closed 7.2 thousand buy contracts and 2.8 thousand sell contracts. Thus, the net position of professional players decreased by 4 thousand. However, the main thing to note is that the green and red lines of the first indicator (indicating the change in the net positions of the "Non-commercial" and "Commercial" groups) have been near the zero level for a long time, as well as near each other. In the last few months, when the European currency continued to fall against the dollar, the major players no longer increased their shorts. Thus, the question arises, why did the euro fall at all if market participants did not sell it? Perhaps global factors, such as changes in the balance between the EU and US money supply, are interfering in the exchange rate formation process again. But according to COT reports, we can only conclude that the "bearish" mood is minimal and has not intensified in recent months. Nevertheless, taking into account the fundamental background, the fall in the quotes of the euro currency may continue. And the technical picture does not yet give any reason to assume the completion of the fall of the euro currency. The mood of the major players remains "bearish", but at the same time, the bulls do not seek to change anything.
Analysis of fundamental events.
As already mentioned, the current week was full of various macroeconomic publications and fundamental events. In addition to the announcement of the results of the ECB and Fed meetings, data on retail sales, industrial production, and business activity in the United States were also published. However, they were naturally in the shadow of two central bank meetings. On Wednesday and Thursday, when the meetings ended, the markets initially bought the euro, which, from our point of view, was not entirely logical. However, a powerful fall in the euro followed on Friday, although no important events were planned for that day. Thus, in the end, everything was put in its place, and the pair may rush down again if the bears have not yet had enough of the sales. As mentioned above, there are no special reasons to assume the completion of the downward trend at this time.
Trading plan for the week of December 20-24:
1) In the 24-hour timeframe, the trend remains downward. At the moment, the quotes remain below the Kijun-sen line, and traders continue to show that they are not ready to buy the euro currency. Thus, the downward movement can continue at any time with the targets of the support level of 1.1144 and 1.1038 (76.4% Fibonacci). The fundamental background currently supports the further fall of the euro and the growth of the dollar. The only hope of the euro currency is that all the factors of the dollar's growth have already been worked out by the market.
2) As for purchases of the euro/dollar pair, in the current conditions, they should be considered no earlier than fixing the price above the critical line. And ideally - above the Ichimoku cloud, because the price has already overcome the Kijun-sen several times, but then could not continue moving up. There are no prerequisites for a new uptrend to begin in the near future yet. First of all, technical.
Explanations to the illustrations:
Price levels of support and resistance (resistance /support), Fibonacci levels - target levels when opening purchases or sales. Take Profit levels can be placed near them.
Ichimoku indicators (standard settings), Bollinger Bands (standard settings), MACD (5, 34, 5).
Indicator 1 on the COT charts - the net position size of each category of traders.
Indicator 2 on the COT charts - the net position size for the "Non-commercial" group.


