Bitcoin continues to hover within a wide range of $40,000-$50,000, and gradually decreases to its lower boundary. As of December 17, the cryptocurrency made a bearish breakout of an important support zone in the area of $47,000-$48,000. As of December 18, the asset is trading near $46,800, while testing the support area at $45,700. Bitcoin has maintained its downward trend for the 5th week in a row, and there are no signals that it could make a reversal.
Why Bitcoin is weak
I would like to highlight two main reasons why the cryptocurrency is having trouble holding key support areas. They are interrelated and are primarily related to the fundamental background of the global economy and the rate of inflation growth.
Lack of activity from buyers
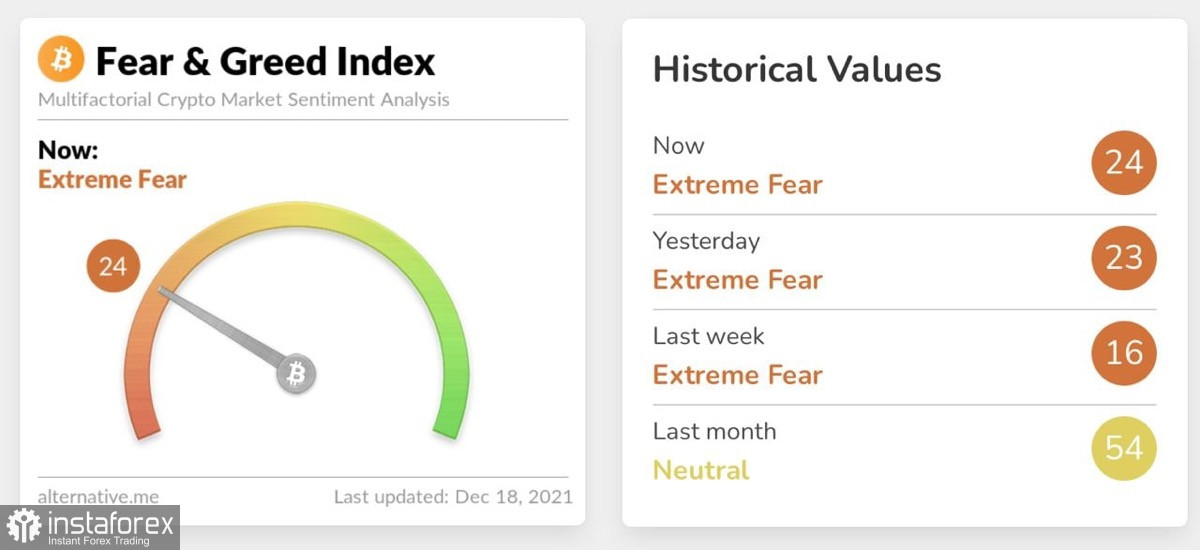
The first reason is that the buyers are showing a lack of activity in the market. The scenario resembles the picture of May and July 2021, when bulls also behaved passively and accumulated volumes while the price was testing support zones and declining time after time. At the same time, BTC actively accumulates volumes, which is a sign of a bull market. The Fear and Greed Index is still in the fear zone, so we can't hope to actively buy back the current positions.
Central Bank policies
The second reason is the US monetary policy followed by the central banks of developed countries. Due to the worsening rate of inflation of the US dollar, most regulators began to pursue an aggressive policy to curb the depreciation of fiat money. As a result, investors do not consider high-risk assets with increased volatility as an investment. The process of permanent buying and selling of assets should not be confused with the cycle of accumulation, which is now carried out by large investors. With the first option, quotes go up here and now, while the accumulation process involves holding on a long-term basis.
Forecast on BTC/USD
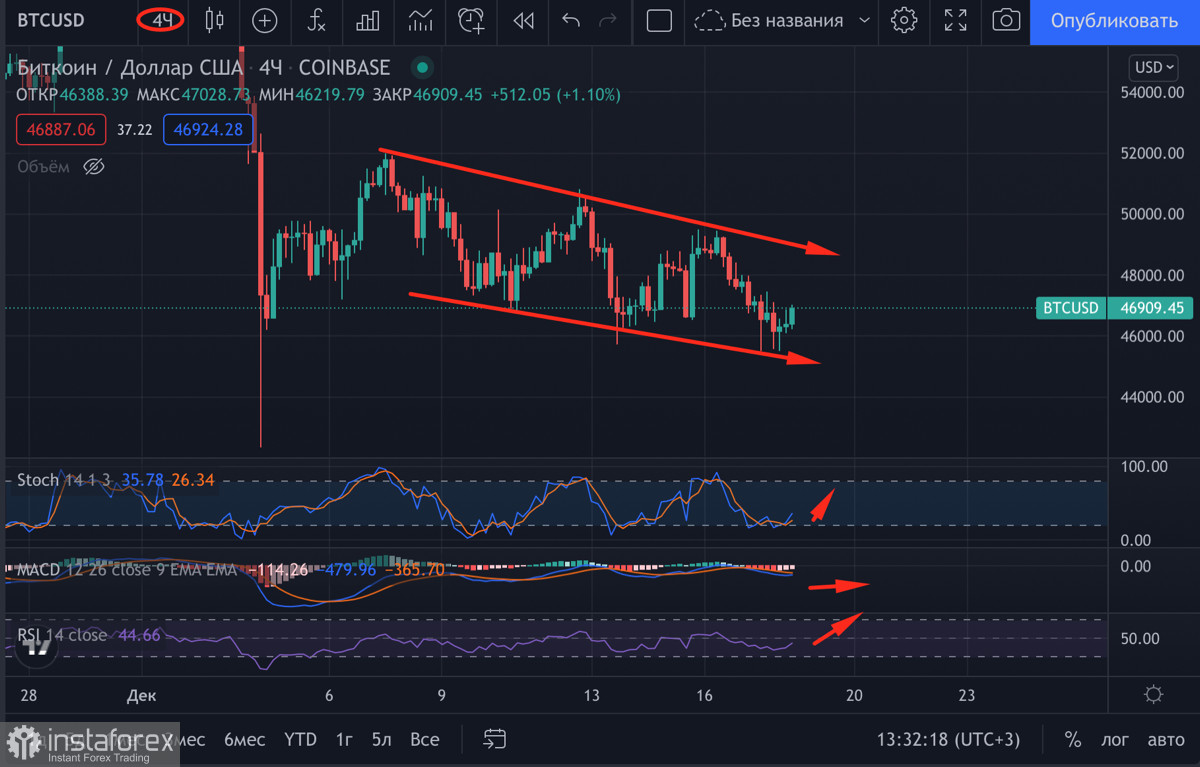
The 4-hour chart shows that bitcoin is trading within the local descending channel. After the breakout of $47,000, buyers make an attempt to push the price higher. The Relative Strength Indicator and the stochastic oscillator signaled this. At the same time, the MACD continues a sideways movement with no prerequisites for growth. Therefore, the price's attempt to climb up to $47,000 was unsuccessful and it may hover within the range of $45,000-$47,000. This is also hinted at by the weak buyback, and the weak candlesticks prove this. I assume that the cryptocurrency may start climbing to the $42,000-$45,000 range early next week.
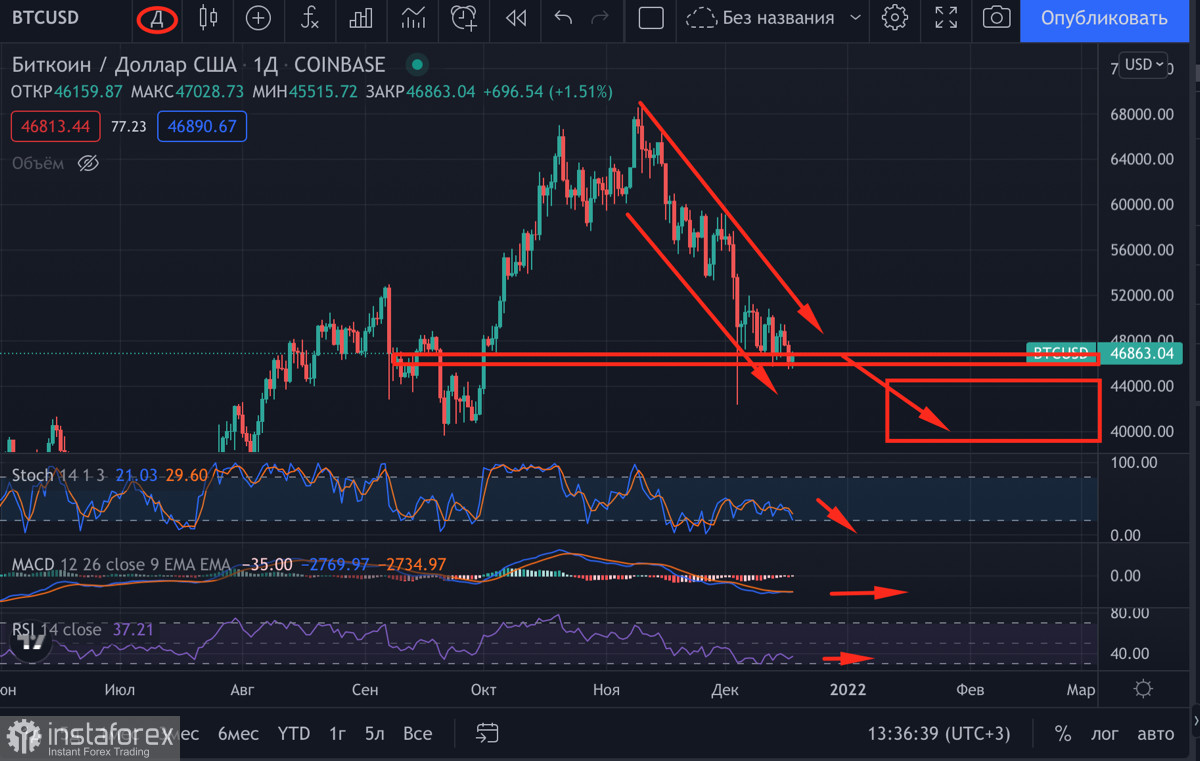
BTC/USD on the daily chart
In general, the situation remains tense as bitcoin continues its downward movement within the downward trading channel from November 9. The trend is still local, but with a retest of $42,000, its potential becomes threatening for the BTC bull market. On the daily chart, technical indicators also show a retest of the $42,000-$45,000 area. The market is waiting for the denouement, where there are two options. In the first, we complete the local downtrend and launch the final fifth wave of growth, or the fall is exacerbated and BTC market risks changing to the bear market.