Crypto Industry News:
As the on-chain data shows, whales have been selling a large amount of their bitcoins for several months. In the same period, the number of portfolios of smaller BTC investors reached new ATH.
A leading analytical company from the blockchain market - Santiment - classifies BTC investors as whales, who own a number of 100 to 10,000 BTC. The company said in a recent Twitter post that the amount of BTC stored in whale wallets is declining.
The downward trend could be seen strongly in September, however, at some point, the trend was reversed when the bitcoin rate temporarily jumped at the end of the previous month. Even so, the first cryptocurrency failed to maintain its gains, and the whales began to shed their digital assets. Currently, this group of investors owns only 45.6% of the total supply of bitcoin. It is also the lowest figure in 3 years.
Technical Market Outlook:
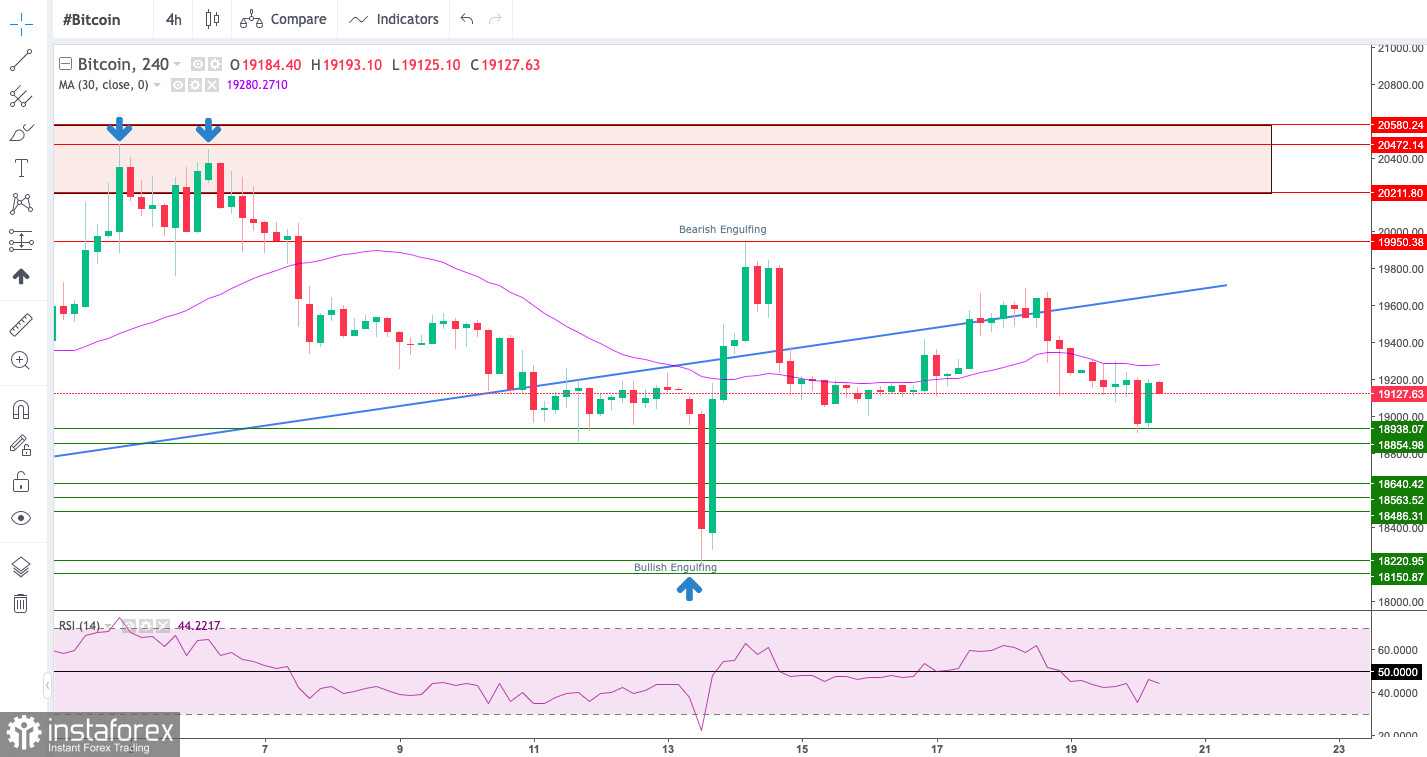
The BTC/USD pair bounce had been rejected from the trend line resistance seen around the level of $19,600 and is heading lower. There is still missing one more wave to the downside in order to complete the Falling Wedge pattern. The momentum is weak and negative on the H4 time frame chart, which supports the short-term bearish outlook for BTC that should result in another down wave. The nearest technical support is seen at $18,938 and $18,854, however, the target for bears is the swing low and range low seen at the level of $18,150. The supply zone located between the levels of $20,221 - $20,580 (marked as a red rectangle) is very important for bulls from a technical point of view, because only a sustained breakout above it would change the outlook to more bullish, so please keep an eye on this zone for a possible breakout towards the next target seen at $22,410.

Weekly Pivot Points:
WR3 - $19,510
WR2 - $19,356
WR1 - $19,287
Weekly Pivot - $19,202
WS1 - $19,133
WS2 - $19,048
WS3 - $18,894
Trading Outlook:
The down trend on the H4, Daily and Weekly time frames continues without any indication of a possible trend termination or reversal. So far every bounce and attempt to rally is being used to sell Bitcoin for a better price by the market participants, so the bearish pressure is still high. The key long term technical support at the psychological level of $20,000 had been violated, the new swing low was made at $17,600 and if this level is violated, then the next long-term target for bulls is seen at $13,712. On the other hand, the gamechanging level for bulls is located at $25,367 and it must be clearly violated for a valid breakout.


