Technical Market Outlook:
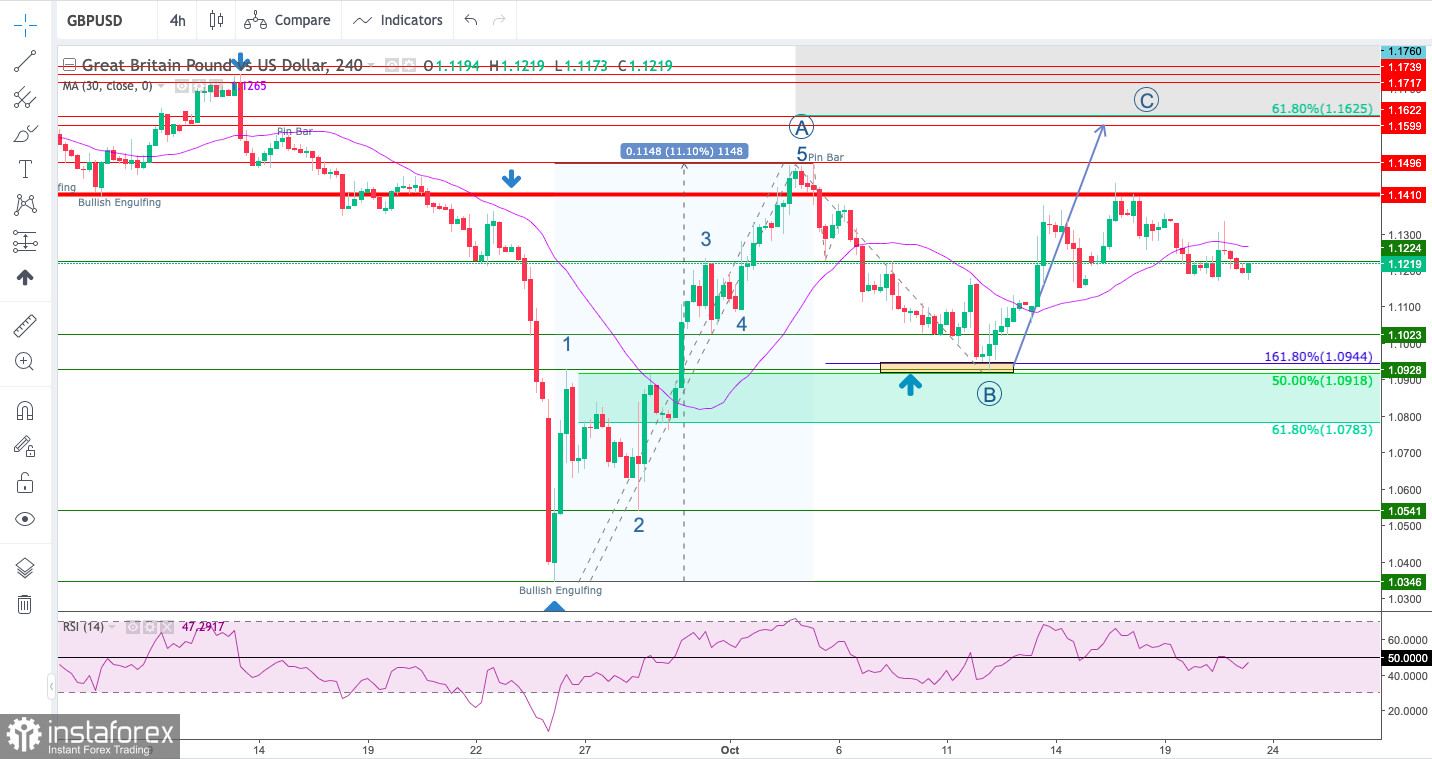
The GBP/USD pair has been seen moving away from the level of 1.1410 and is currently consolidating around the technical support seen at 1.1224 (intraday technical support ). The last bounce had been terminated with a Doji candlestick pattern at the H4 time frame chart, however, the bulls keep trying to move higher. Please notice there is still wave C waiting to develop to the upside as the ABC corrective cycle hasn't been completed yet, however any breakout below the level of 1.0923 will invalidate the ABC corrective cycle scenario. The momentum is negative already, so please watch the technical support level for any sign of weakness, because the down move continuation might hit the next technical support located at 1.1037.

Weekly Pivot Points:
WR3 - 1.14475
WR2 - 1.13577
WR1 - 1.13206
Weekly Pivot - 1.12679
WS1 - 1.12308
WS2 - 1.11781
WS3 - 1.10883
Trading Outlook:
The bears are still in charge of Cable and the next long-term target for them is the parity level. The level of 1.0351 has not been tested since 1985, so the down trend is strong, however, the market is extremely oversold on longer time frames already. In order to terminate the down trend, bulls need to break above the level of 1.2275 (swing high from August 10th).


