To open long positions on GBP/USD, you need:
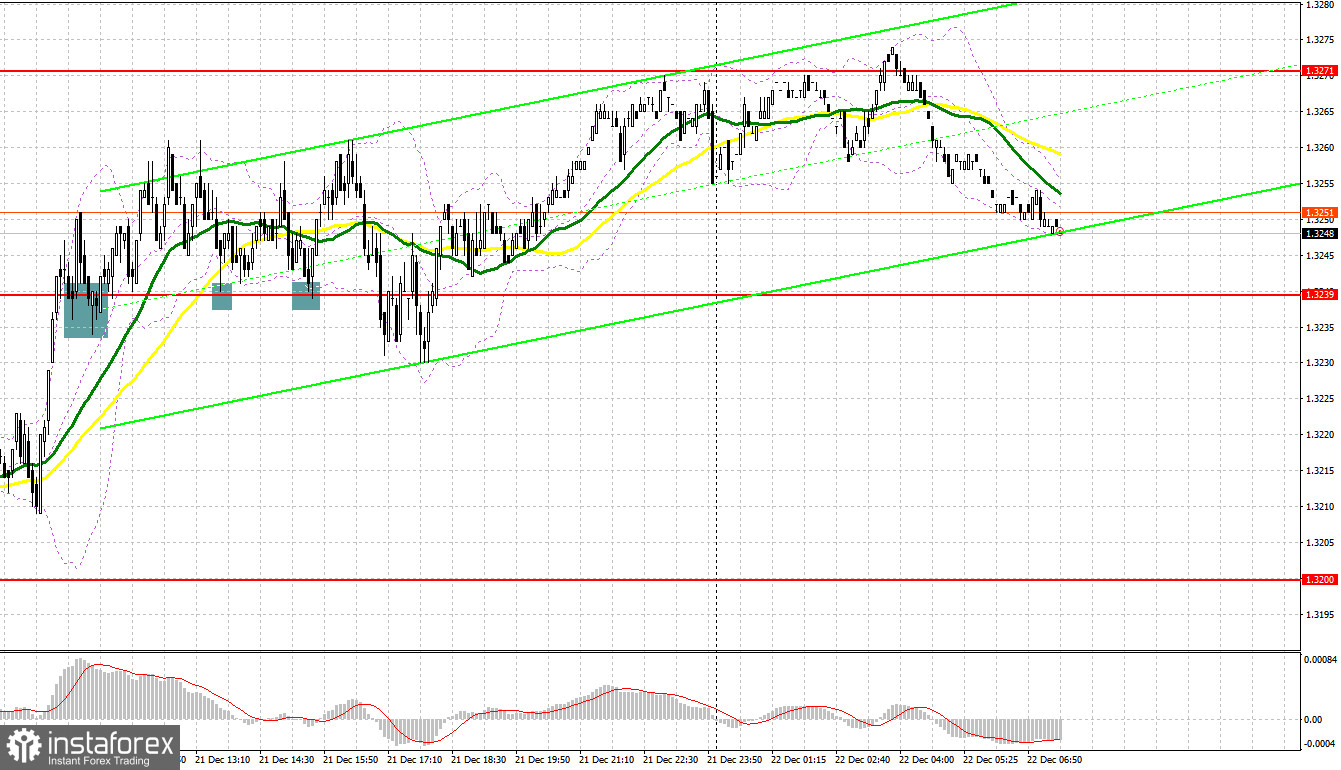
Several good signals to enter the market were formed yesterday. Let's take a look at the 5 minute chart and understand the entry points. In my morning forecast, I drew attention to the 1.3239 level and advised you to make decisions on entering the market from it. A breakthrough and consolidation above 1.3239 after the release of UK retail sales led to forming a signal to buy the pound, as the bulls managed to protect this range after a downward test of 1.3239. The first upward movement was about 20 points. In my afternoon forecast, I drew attention to the importance of protecting this area and the formation of a false breakout. There were two of them, and each time the pair showed an increase of 20 points. At the end of the day, the bulls managed to update the large resistance at 1.3271, as they have not managed to surpass this level.

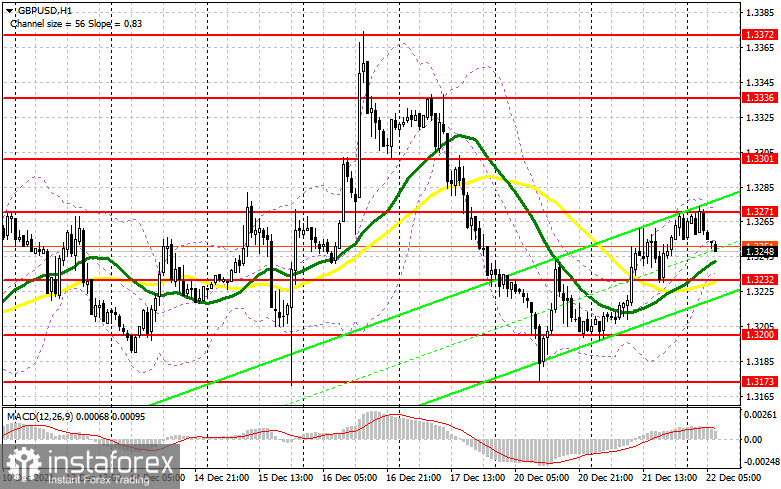
Quite important data on the UK economy will be released today. In the morning I advise you to familiarize yourself with the report on the change in the volume of UK GDP for the third quarter of this year. The bulls' primary task for today is to protect and form a false breakout in the 1.3235 area, by analogy with what I discussed a little higher. Only strong economic data revised upward and an increase in the UK's current account balance will lead to a good signal to buy the pound with the prospect of a return to the 1.3271 area, which was tested this morning. A breakthrough and test of 1.3271 is also an important task, as going beyond this range will allow the bulls to strengthen their positions in order to renew the highs: 1.3301 and 1.3336 - and this is already a return to last Friday's levels, from which a large drop in the pound took place. A downside test at 1.3336 will provide another entry point for buying GBP/USD with the prospect of strengthening to 1.3372 - December highs, where I recommend taking profits. In case the pound falls during the European session and traders are not active at 1.3232, and there are moving averages, playing on the bulls' side, I advise you not to rush. Forming a false breakout near the next low at 1.3200 will give an entry point to buy the pound and the bulls' last hope to keep trading in a horizontal channel. It is possible to buy GBP/USD immediately on a rebound in the area of 1.3173, counting on a correction of 20-25 points within the day.
To open short positions on GBP/USD, you need:
The bears do not have much control of the market yet, although they fight back the bulls every time after the new highs. The bears should not release the pound above 1.3271, as this will lead to the demolition of a number of stop orders and a more active recovery of the pair. Only weak data on UK GDP and the formation of a false breakout at 1.3271 will form a good entry point for short positions with a subsequent decline to the 1.3232 area, which will have to be fought for. A breakdown of 1.3232, together with the moving averages, will increase pressure on the pound and push GBP/USD to a major support at the bottom of the 32nd figure, where bulls will actively show themselves. However, a reverse test of 1.3200 from the bottom up will provide an excellent entry point into short positions with the prospect of a decline as early as 1.3173, where I recommend taking profits. In case the pair grows during the European session and the bears are not active at 1.3271, together with strong data on UK GDP, it is best to postpone selling until the larger resistance at 1.3301. I also recommend opening short positions there only in case of a false breakout. Selling GBP/USD immediately on a rebound is possible only from a large resistance at 1.3336, or even higher - from a new high in the 1.3372 area, counting on the pair's rebound down by 20-25 points within the day.

I recommend for review:
The Commitment of Traders (COT) report for December 14 revealed that both short and long positions decreased. Considering that long positions nearly halved, this led to major changes in the negative delta. At the same time, it should be noted that this data does not include the outcome of the meetings of the US Federal Reserve and the Bank of England. As a whole, the outlook for the British pound is rather gloomy. Following the Bank of England's decision to raise interest rates, the pair rallied. However, the very next day, it faced a sell-off. As a result, many market participants hoping for the end of the bearish trend were out of the market. The US dollar will most likely enjoy high demand amid uncertainty over the new Omicron coronavirus strain, which is spreading at a fairly rapid pace, scaring off market participants from active actions. No one wants to buy an overbought dollar. At the same time, a weak pound is not attractive to investors. Until the situation with the new coronavirus wave returns to normal, the British pound will hardly gain strong upside momentum. However, high inflation remains the main reason why the Bank of England will continue to raise interest rates next year. This fact is likely to support the pound sterling. The COT report released on December 14 indicated that long non-commercial positions declined to 29,497 from 48,950, while short non-commercial positions dropped to 80,245 from 87,227. This resulted in an increase in the negative non-commercial net position from 38,277 to -50 748. The weekly closing price dipped to 1.3213 from 1.3262.
Indicator signals:
Trading is carried out just above the 30 and 50 moving averages, which indicates a possible continued growth of the pound.
Moving averages
Note: The period and prices of moving averages are considered by the author on the H1 hourly chart and differs from the general definition of the classic daily moving averages on the daily D1 chart.
Bollinger Bands
A breakthrough of the lower border of the indicator in the area of 1.3232 will increase the pressure on the pair. In case of growth, the upper border of the indicator in the area of 1.3271 will act as a resistance.
Description of indicators
- Moving average (moving average, determines the current trend by smoothing out volatility and noise). Period 50. It is marked in yellow on the chart.
- Moving average (moving average, determines the current trend by smoothing out volatility and noise). Period 30. It is marked in green on the chart.
- MACD indicator (Moving Average Convergence/Divergence — convergence/divergence of moving averages) Quick EMA period 12. Slow EMA period to 26. SMA period 9
- Bollinger Bands (Bollinger Bands). Period 20
- Non-commercial speculative traders, such as individual traders, hedge funds, and large institutions that use the futures market for speculative purposes and meet certain requirements.
- Long non-commercial positions represent the total long open position of non-commercial traders.
- Short non-commercial positions represent the total short open position of non-commercial traders.
- Total non-commercial net position is the difference between short and long positions of non-commercial traders.


