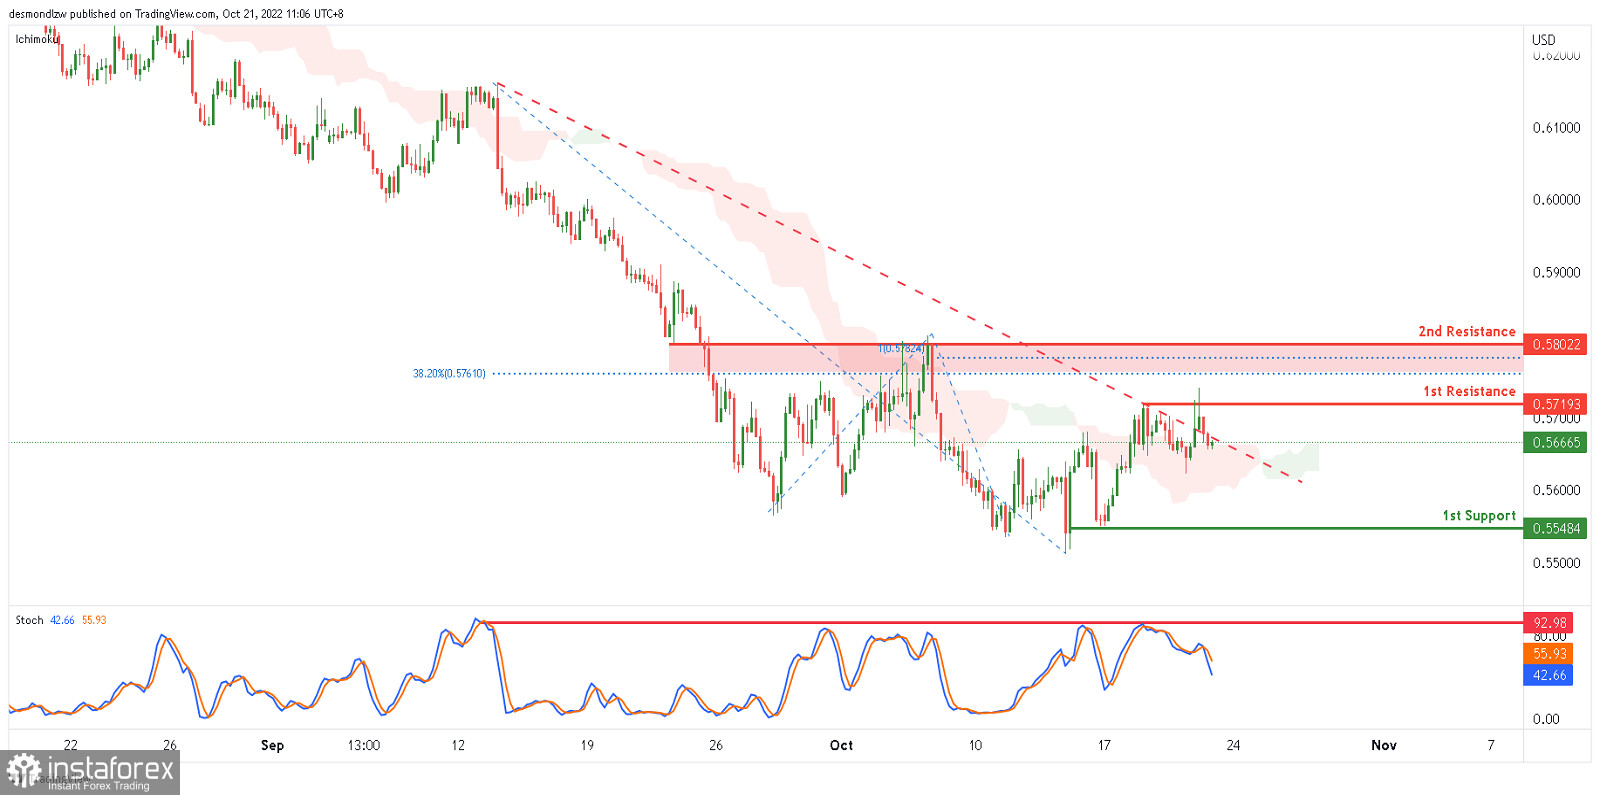
On the H4 chart, the overall bias for NZDUSD is bearish. To add confluence to this, price is below the Ichimoku cloud which indicates a bearish market. However, price is above the Ichimoku cloud which might indicate a short term bullish market. Expecting price to possibly break above the 1st resistance at 0.57193 and possibly head towards the 2nd resistance at 0.58022 where the 38.2% Fibonacci line, 100% Fibonacci projection line and previous high are located..
Trading Recommendation
Entry: 0.5719
Reason for Entry: Breakout buy entry
Take Profit: 0.5802
Reason for Take Profit:
Previous swing high
Stop Loss: 0.58022
Reason for Stop Loss:
Previous swing high, 100% fibonacci projection and 38.2% fibonacci retracement


