


Weekly Review of EUR/USD :
Trend : up trend.
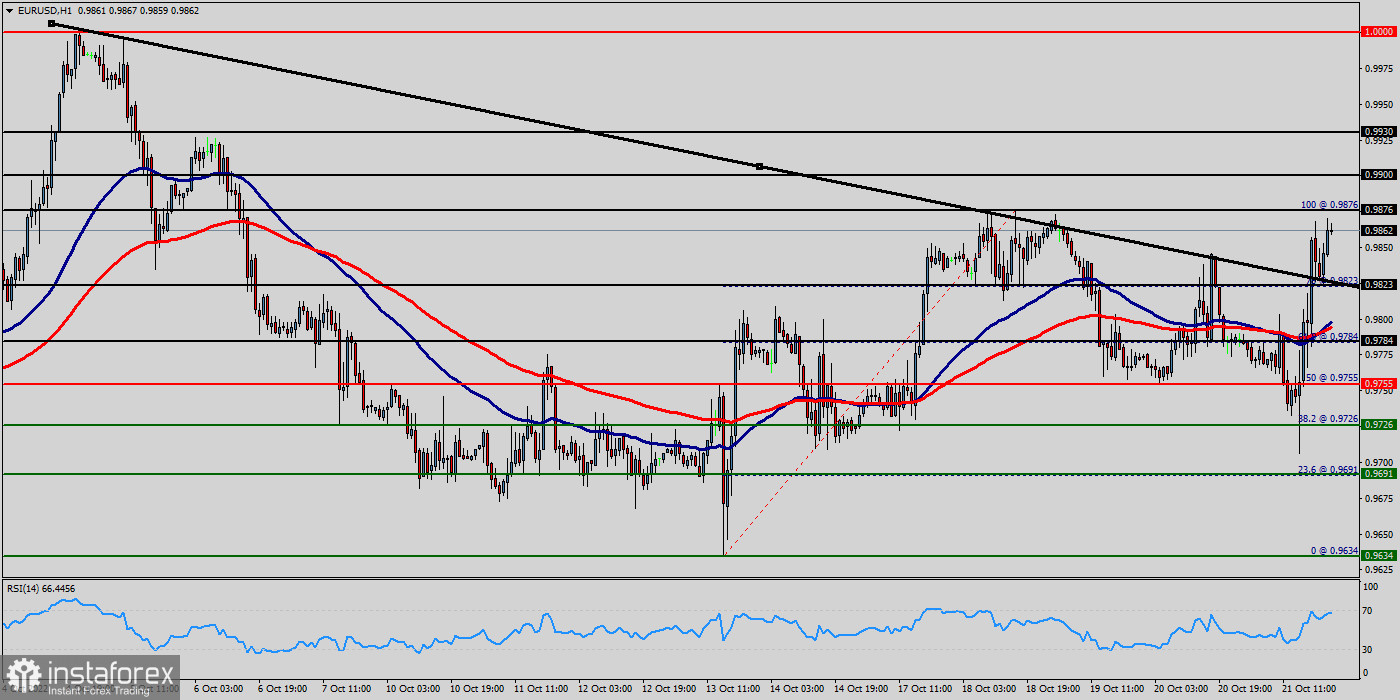
Pivot : 0.9784.
The bullish trend is currently very strong on the EUR/USD pair. As long as the price remains above the support levels of 0.9972, you could try to benefit from the growth. The first bullish objective is located at the price of 0.9859. The bullish momentum would be boosted by a break in this resistance (0.9859). The hourly chart is currently still bullish. At the same time, some stabilization tendencies are visible between 0.9815 and 0.9859. Together with the relatively large distance to the fast-rising 100-day moving average (0.9859), there are some arguments for a relief rally in coming months on the table. The EUR/USD pair is at highest against the dollar around the spot of 0.9859 since last week. The EUR/USD pair is inside in upward channel. For three weeks the EUR/USD pair decreased within an up channel, for that the EUR/USD pair its new highest 0.9859. Consequently, the first support is set at the level of 0.9972. Hence, the market is likely to show signs of a bullish trend around the area of 0.9972 - 0.9859. RSI is seeing major support above 65% and a bullish divergence vs price also signals that a reversal is impending. According to the previous events the price is expected to remain between 0.9815 and 0.9919 levels. Buyers would then use the next resistance located at 0.9815 as an objective. Crossing it would then enable buyers to target 0.9859 (the double top - last bullish week). Be careful, given the powerful bullish rally underway, excesses could lead to a possible correction in the short term. If this is the case, remember that trading against the trend may be riskier. It would seem more appropriate to wait for a signal indicating reversal of the trend. The EUR/USD pair has plunged up for a fresh two weeks high. Prices pushed above a key retracement from a Fibonacci setup that spans from the lowest price of 0.9772 (38.2% of Fibonacci on the hourly chart), for that buyer pulled the bid back-above that level by the end of the week. Last week, the EUR/USD pair traded up and closed the day in the red area near the price of 0.9772 . Today it rose a little, rising above 0.9772 . If the pair succeeds in passing through the level of 0.9859, the market will indicate the bullish opportunity above the level of 0.9859 in order to reach the second target at 0.9919. In the very short term, the general bullish sentiment is confirmed by technical indicators. Therefore, a small upwards rebound in the very short term could occur in case of excessive bearish movements. The trend is still bullish as long as the price of 0.9859 is not broken. Thereupon, it would be wise to re-buy above the price of at 0.9919 with the objective of 0.9960. We should see the pair climbing towards the next target of 0.9960. The pair will move upwards continuing the development of the bullish trend to the level 1USD in coming days.
Next day of the week :
The bullish trend is currently very strong for the EUR/USD pair. As long as the price remains above the support at 0.9815, you could try to take advantage of the bullish rally in short term. The first bullish objective is located at 0.9859. The bullish momentum would be revived by a break in this resistance. For two weeks, the EUR/USD pair increased within an up channel, for that Euro hits new highs 0.9859 and 0.9876. The EUR/USD pair price had a significant breakout above the price of 0.9823. The EUR/USD pair is part of a very strong bullish trend. Traders may consider trading only long positions as long as the price remains well above the levels of 0.9823. Currently, the price is in a bullish channel. This is confirmed by the RSI indicator signaling that we are still in a bullish trending market. As the price is still above the moving average (100), immediate support is seen at 0.9784, which coincides with a golden ratio (61.8% of Fibonacci). Consequently, the first support is set at the level of 0.9784. Hence, the market is likely to show signs of a bullish trend around the spot of 0.9784 and 0.9823. The next resistance located at 0.9876 (this price is coincided with the ratio 61.8% of Fibonacci retracement levels) is the next bullish target to be reached. A bullish break in this resistance would boost the bullish momentum. The bullish movement could then continue towards the next resistance located at 0.9919. Closing above the pivot point (0.9784) could assure that EUR/USD will move higher towards cooling new highs. The bulls must break through 0.9815 in order to resume the up trend. Buyers would then use the next resistance located at 0.9876 as an objective (this price is coincided with the ratio 100% of Fibonacci retracement levels - the double top - te last bullish wave on the hourly chart).
Still bullish market all the week:
The bullish trend is currently very strong for the EUR/USD pair. As long as the price remains above the support at 0.9815, you could try to take advantage of the bullish rally in short term. The first bullish objective is located at 0.9859. The bullish momentum would be revived by a break in this resistance. For two weeks, the EUR/USD pair increased within an up channel, for that Euro hits new highs 0.9859 and 0.9876. The EUR/USD pair price had a significant breakout above the price of 0.9823. The EUR/USD pair is part of a very strong bullish trend. Traders may consider trading only long positions as long as the price remains well above the levels of 0.9823. Currently, the price is in a bullish channel. This is confirmed by the RSI indicator signaling that we are still in a bullish trending market. As the price is still above the moving average (100), immediate support is seen at 0.9784, which coincides with a golden ratio (61.8% of Fibonacci). Consequently, the first support is set at the level of 0.9784. Hence, the market is likely to show signs of a bullish trend around the spot of 0.9784 and 0.9823. The next resistance located at 0.9876 (this price is coincided with the ratio 61.8% of Fibonacci retracement levels) is the next bullish target to be reached. A bullish break in this resistance would boost the bullish momentum. The bullish movement could then continue towards the next resistance located at 0.9919. Closing above the pivot point (0.9784) could assure that EUR/USD will move higher towards cooling new highs. The bulls must break through 0.9815 in order to resume the up trend. Buyers would then use the next resistance located at 0.9876 as an objective (this price is coincided with the ratio 100% of Fibonacci retracement levels - the double top - te last bullish wave on the hourly chart).


