


Technical data:
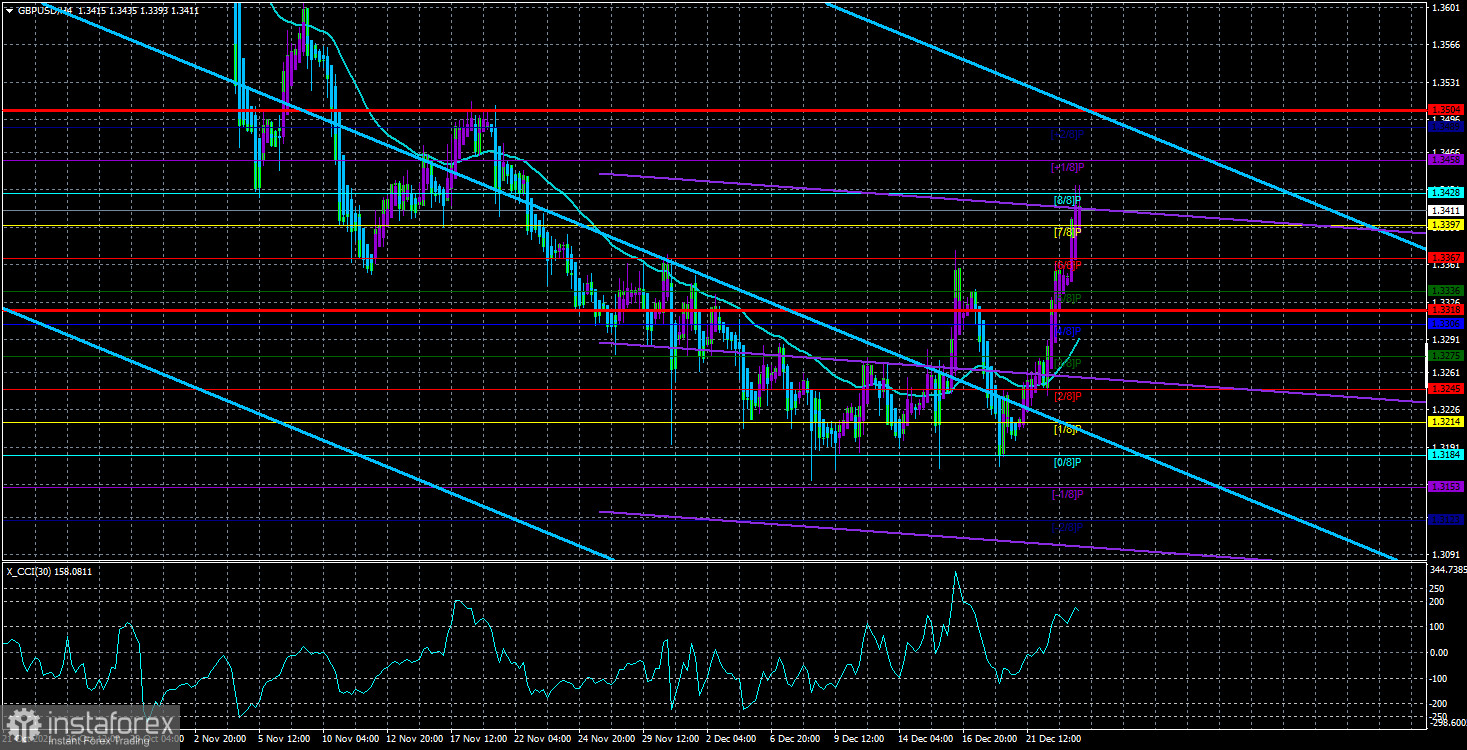
Upper Linear Regression Channel is headed down
Lower Linear Regression Channel is headed down
Moving average (20-day period, smoothed) is headed upward
The GBP/USD pair extended its bull run and left the sideways channel on Thursday. Thus, contrary to the popular belief in lower volatility ahead of the winter holiday season, the pound sterling is showing active growth. It is not just a strong movement, it is also a trend movement. So, the pound/dollar pair is no longer in the sideways channel. We mentioned in our previous reviews that currency pairs could show impressive movement amid a thin market, and GBP/USD confirms that. What is more, EUR/USD and GBP/USD are now moving differently. In fact, the pound does not have a reason for growth at the moment. Indeed, the macroeconomic calendar was empty. However, the sterling climbed higher than after a rate hike by the Bank of England. The thin-market factor, as well as the technical factor, plays an important role here. In our recent weekly reviews, we repeatedly said that a new upswing of 400-500 pips was needed. If we look at the 24-hour time frame, we could notice that the quote moved this way in 2021 most of the time. In addition, the price rebounded from the important Fibonacci level of 38.2% on the 24-hour time frame. So, the pair may reach the level of 1.3600 any time soon. As for the Omicron factor, we assumed yesterday that GBP swelled because the British government refused to introduce a lockdown despite a sharp increase in the number of new COVID-19 cases. At the same time, however, the United States also does not plan to introduce a lockdown. So, on what basis should the pound grow then? After all, nothing has changed in the British economy.
What the year 2022 has in store for GBP?
Since no more fundamentals are expected this year, all expectations will remain for the next year. There are numerous factors that can affect the pound sterling. Starting from Scotland's desire to hold a referendum on independence and ending with the UK-EU relationship that may completely deteriorate. At the same time, it is unclear how the situation with the latest COVID-19 wave in the country will end. In addition, scandals surround Prime Minister Boris Johnson who is harshly criticized by many. Even if he serves a full term, he is unlikely to be elected for the second one. If so, the Conservative Party could lose the majority in the Parliament as Republicans did in the US. As for the pound sterling, the global uptrend may well resume. After all, not everything is going well in the US so that the greenback could continue growing. Moreover, the Bank of England has already raised the benchmark rate. Therefore, the pair is likely to increase by 200-300 pips at the start of the next year, and a new uptrend may start. However, if the UK continues to be the main supplier of negative news to the markets next year, this may force traders to sell off the British currency again.
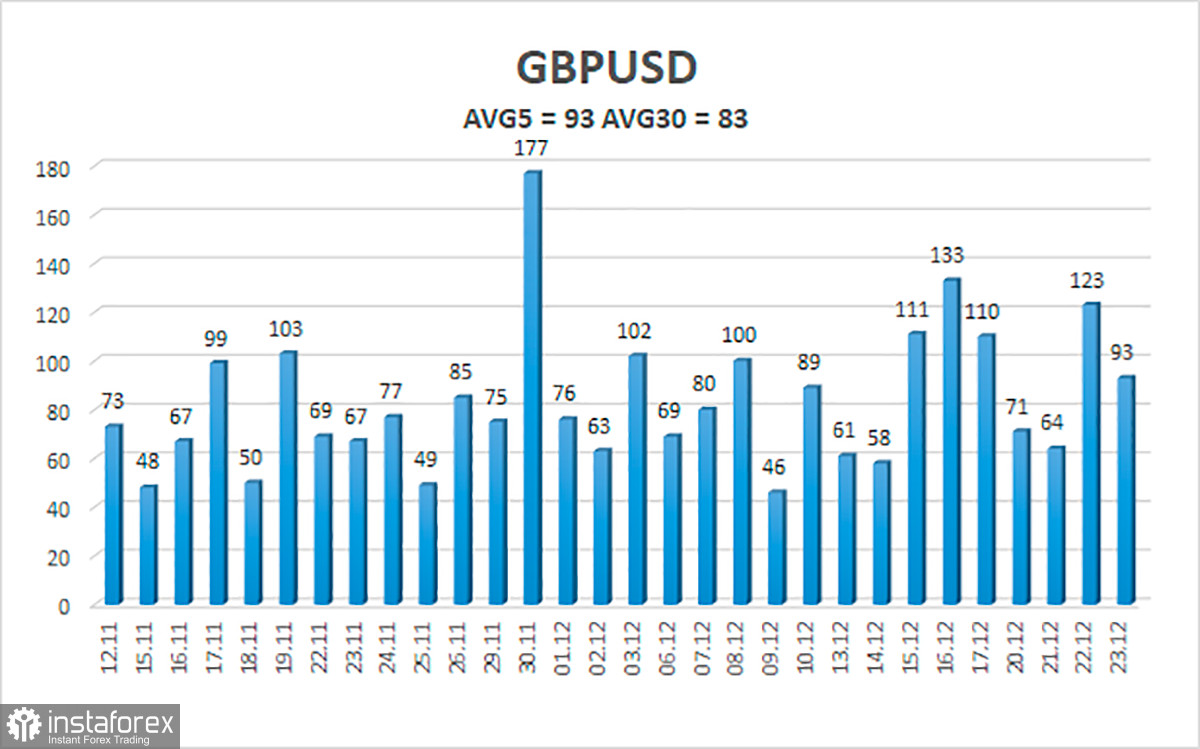
On December 24, the volatility of GBP/USD totals 93 pips. Today, the pair is expected to move in the range of 1.3318 and 1.3504. Heiken Ashi's reversal is likely to indicate a downward correction.
Closest support levels
S1 – 1.3397
S2 – 1.3367
S3 – 1.3336
Closest resistance levels
R1 – 1.3428
R2 – 1.3458
R3 – 1.3489
Outlook:
GBP/USD left the sideways channel and went up, according to the H4 chart. Traders should open long positions after consolidation above the MA. The targets are seen at 1.3458 and 1.3489. Long positions should be closed if Heiken Ashi reverses down. Short positions could be opened in case of fixing below the MA with targets at 1.3245 and 1.3214.
Description of charts:
Linear Regression Channels help identify the current trend. If both channels move in the same direction, the trend is strong.
Moving Average (20-day, smoothed) defines the short-term and current trends.
Murray levels are target levels for trends and corrections.
Volatility levels (red lines) reflect a possible price channel the pair is likely to trade in within the day based on the current volatility indicators.
CCI indicator: when the indicator is in the oversold area (below 250) or in the overbought area (above 250), it means that a trend reversal is likely to occur soon.


