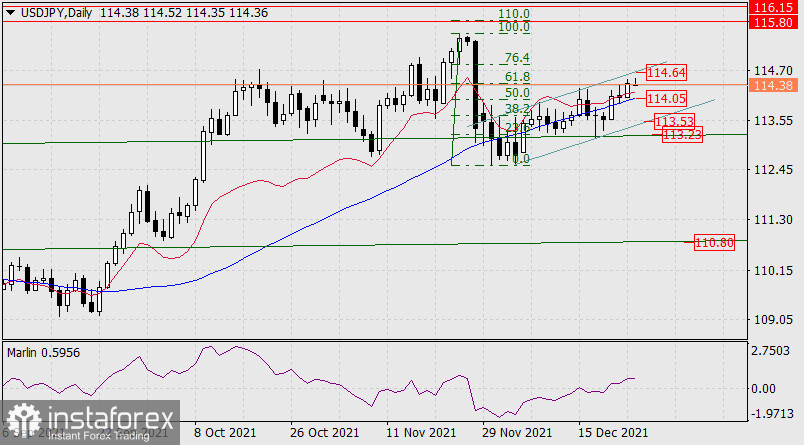
The situation on the USD/JPY pair over the past day has not become clearer, but only even more confusing and multivariate in growing and declining scenarios. Yesterday the price reached the correction level of 61.8% (114.38) and approached the upper border of the local price channel on the daily scale chart.

This upper line is built on three extremes, and in the case of a hypothetical reversal, the fourth time to reach this line, it may not hit the level of 114.64. To confirm this intention, the price must go below the MACD line (114.05). A confirmation of the reversal is when the price leaves this channel (113.53), and overcoming the support at 113.23 will signal the start of a medium-term downward movement (target 110.80).
The exit above 114.64 will open the target range of 115.80-116.15.

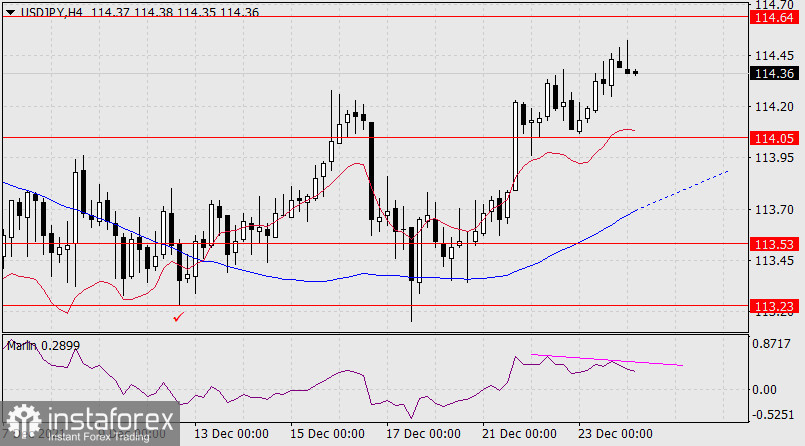
On the four-hour chart, the price showed a tendency to turn down. This is reflected in price divergence with the Marlin Oscillator. In fact, the price is now between two signal levels, which can set the further price movement: 114.05 and 114.64. Between the levels 114.05 and 113.53 is the MACD line, which often acts as an independent line of support and resistance, but in a situation of sideways trends or increased uncertainty, it can lose this property.


