EUR/USD
Analysis:
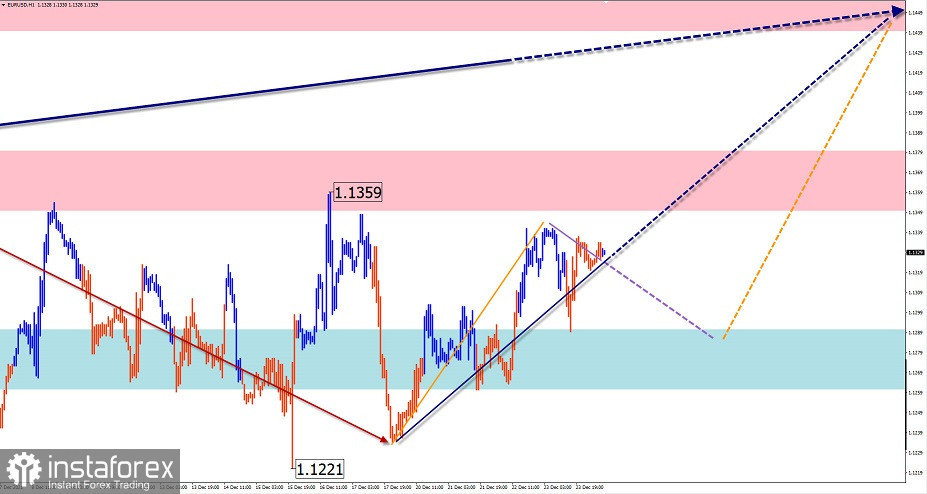
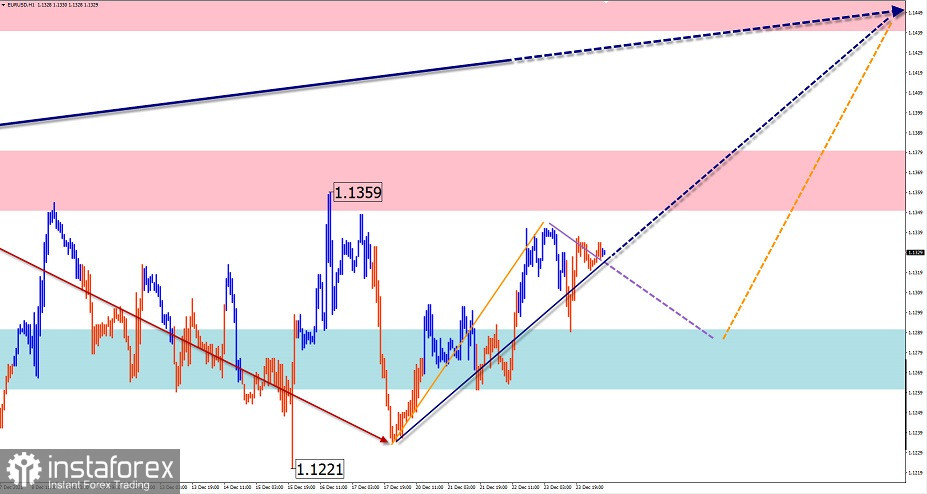
As part of the descending wave that sets a short-term trend, a correction has been forming since the end of November. Its structure most closely resembles a sliding pattern with its final part (C) not completed.
Outlook:
In the first half of the day, a flat movement is more likely. A decline towards the support zone is also possible. By the end of the day, we can expect the resumption of the uptrend. If the price breaks through the upper boundary of the nearest resistance zone, further growth may continue today.
Potential reversal zones:
Resistance:
- 1.1440/1.1470
- 1.1350/1.1380
Support:
- 1.1290/1.1260
Recommendations:
Selling the euro/dollar pair today may result in losses. It is recommended to track the signals for buying the instrument and consider the limited potential of the uptrend.

USD/JPY
Analysis:
The Japanese yen continues to depreciate against the US dollar. In the reversal zone on a higher time frame, the price has formed an extended correction over the last two months. The ascending section of the trend that was formed on November 30 does not have a reversal potential at the time of the analysis. It can either continue the current correction or become the beginning of a new section of the main wave.
Outlook:
After some pressure on the resistance zone, the pair is expected to trade in a sideways channel. At the end of the session, the price is more likely to start a reversal and enter a downtrend.
Potential reversal zones:
Resistance:
- 114.50/114.80
Support:
- 113.90/113.60
Recommendations:
Trading in the Japanese yen market today is risky and may lead to losses. It is worth waiting for buy signals when the current pullback comes to an end.

GBP/JPY
Analysis:
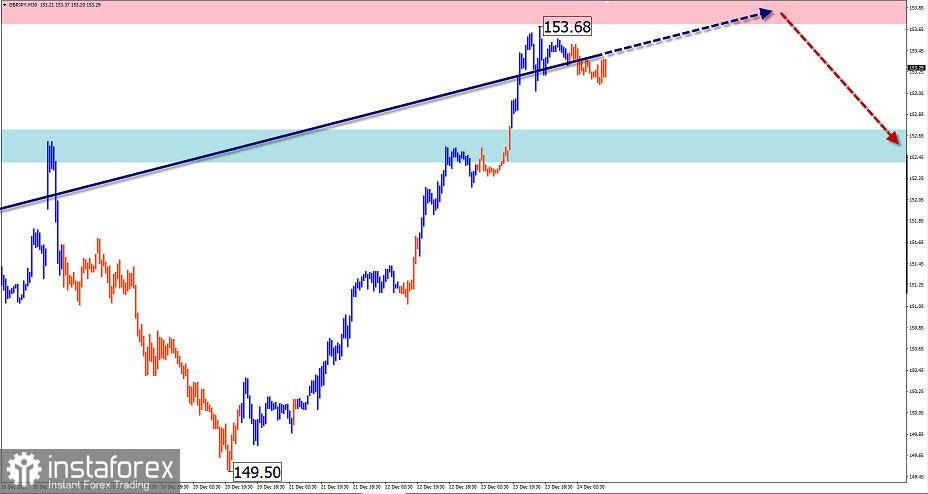
The direction of the short-term trend for the pound/yen pair is set by the descending wave from October 20. The price has been building a complex opposite correction in the form of a shifting plane for the past month. At the time writing, its structure looks complete. The downtrend from December 23 may turn into a reversal and could be the start of a new bearish wave.
Outlook:
In the current session, bulls are likely to put pressure on the resistance zone. A short breakout of the upper boundary is also possible. A trend change and a downward movement are expected at the end of the day.
Potential reversal zones:
Resistance:
- 153.70/154.00
Support:
- 152.70/152.40
Recommendations:
There are no more buying opportunities for the pair today. It is better to refrain from entering the market until clear sell signals appear.

GOLD
Analysis:
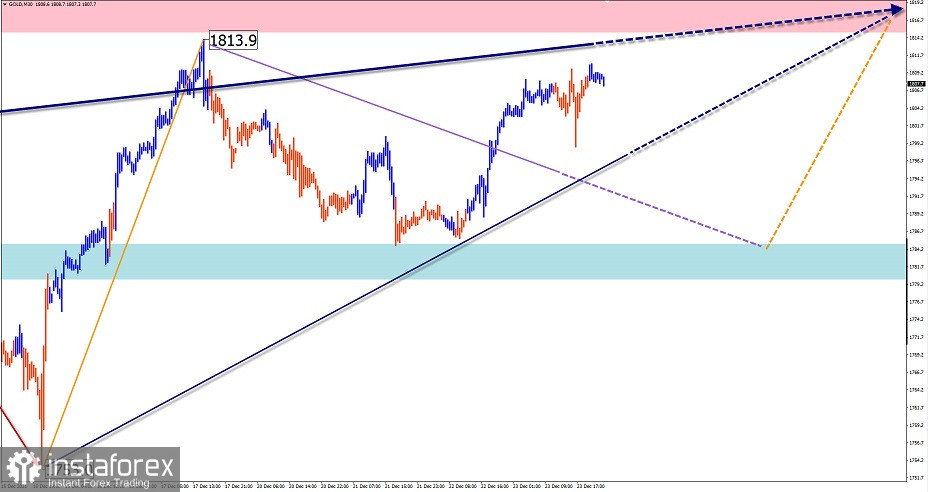
On the gold chart, an ascending wave pattern has been forming for the most part of the year. The current structure resembles a sliding pattern. The incomplete section within the wave is turned downwards. The price has been forming an intermediate pullback for the whole month.
Outlook:
Today, the asset is likely to start a reversal and a subsequent downtrend after some pressure on the resistance zone. The breakout of the lower boundary of the support zone is unlikely today.
Potential reversal zones:
Resistance:
- 1815.0/1820.0
Support:
- 1785.0/1780.0
Recommendations:
Today, it is advisable to trade gold only within the intraday chart with fractional lots. Currently, there are no conditions for buying gold. Selling will become possible when clear sell signals appear near the resistance zone.

Explanations: In simplified wave analysis (SWA), waves consist of 3 parts (A-B-C). The last unfinished wave is analyzed. The solid arrow background shows the structure that has been formed. The dashed lines show the expected movements.
Note: The wave algorithm does not take into account the duration of the instrument's movements over time.


