


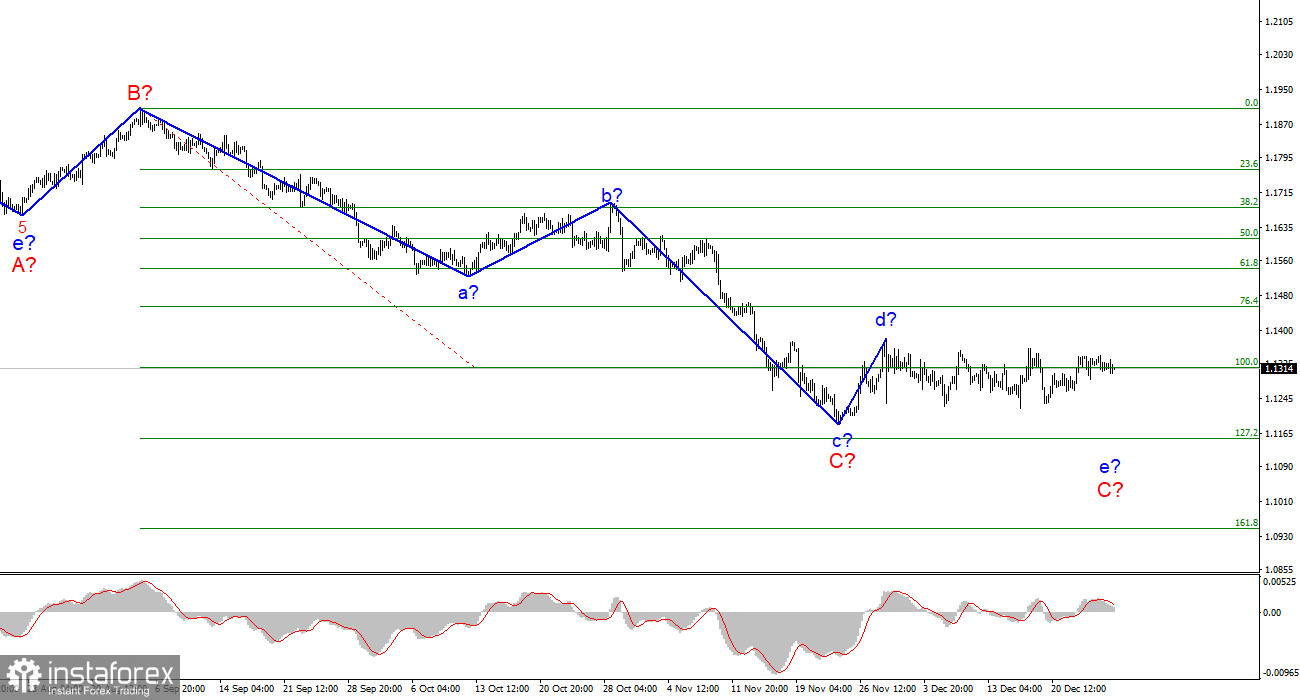
The wave pattern of the H4 chart for the Euro/Dollar instrument continues to remain integral and does not require additions. The construction of a downward wave e in C is still questionable since the current wave takes a very extended, horizontal form. If the downward wave does not continue its construction, then wave C will have to be recognized as three-wave and completed, although I believe that it should still take a five-wave form.
The wave that originates on November 30 still cannot be attributed to either wave C or the first wave of a new upward trend segment, if it really is, since neither the peak of wave d in C nor the low of wave c in C has been broken over the past few weeks.
In the current situation, we can only wait for the situation to develop. Given that the holidays have already begun, the current wave may take on an even longer form. And now it makes no sense to understand its internal waves since this structure can turn out to be almost any length.
New Year's week has begun
There was no news background for the EUR/USD instrument on Monday, as well as on Friday and for most of the previous week. The instrument demonstrated an amplitude of 15 basis points for the second day in a row. With such an amplitude, there is nothing to hope for. I have been observing horizontal movement for more than a month, which is very difficult to attribute unambiguously to any wave. And it is unlikely that this movement will end in 2021, if it did not end when the news background was.
Thus, I believe that now the markets have already moved into a state of waiting for the end of the holidays. Therefore, we should calmly celebrate the New Year, and in the new year, we should consider new trading tactics and predict the movement of the instrument.
General conclusions
Based on the analysis, I conclude that the construction of the downward wave C can be completed. However, the internal wave structure of this wave still allows the construction of another downward, internal wave. Thus, I advise selling the instrument with targets located around the 1.1152 mark, for each downward signal from the MACD, until a successful attempt to break the peak of wave d occurs. New sales should not be opened on each signal. It is better to place a restrictive order above the peak of wave d once.
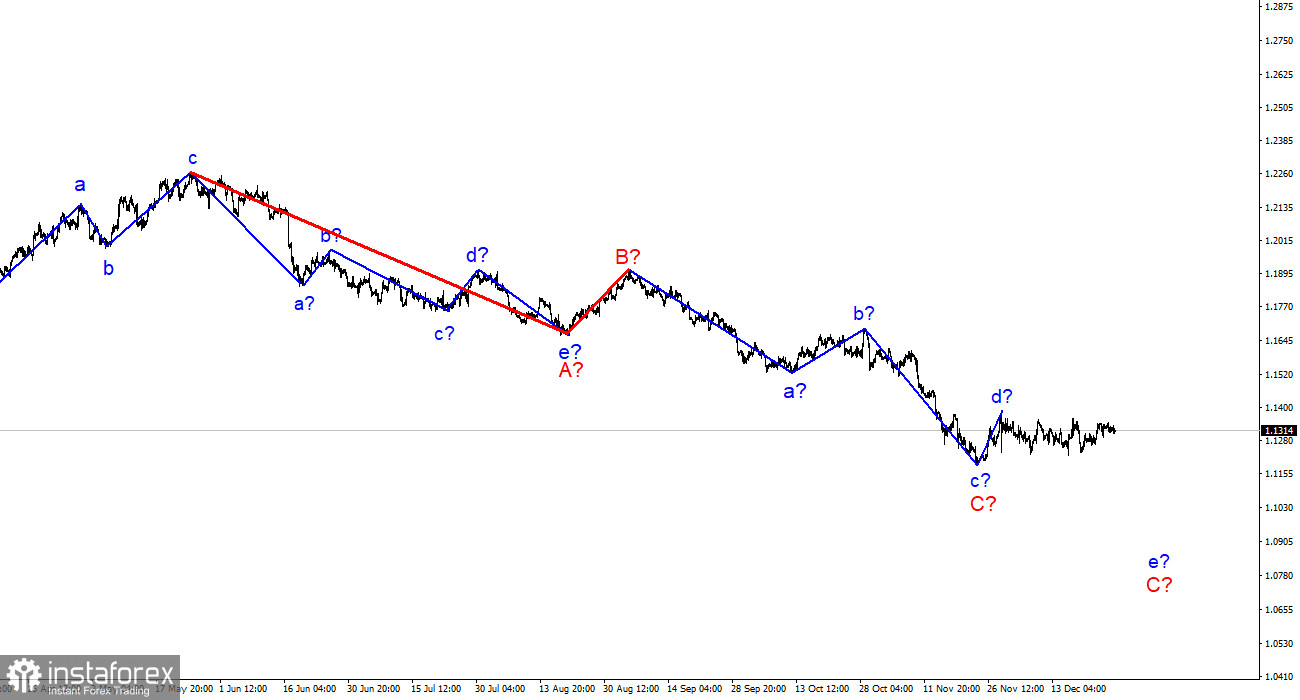
The wave pattern of the higher scale looks quite convincing. The decline in quotes continues and now the downward section of the trend, which originates on May 25, takes the form of a three-wave corrective structure A-B-C. Thus, the decline may continue for several more weeks until wave C is fully completed (it should take a five-wave form in this case).


