


Analysis of previous deals:
30M chart of the EUR/USD pair
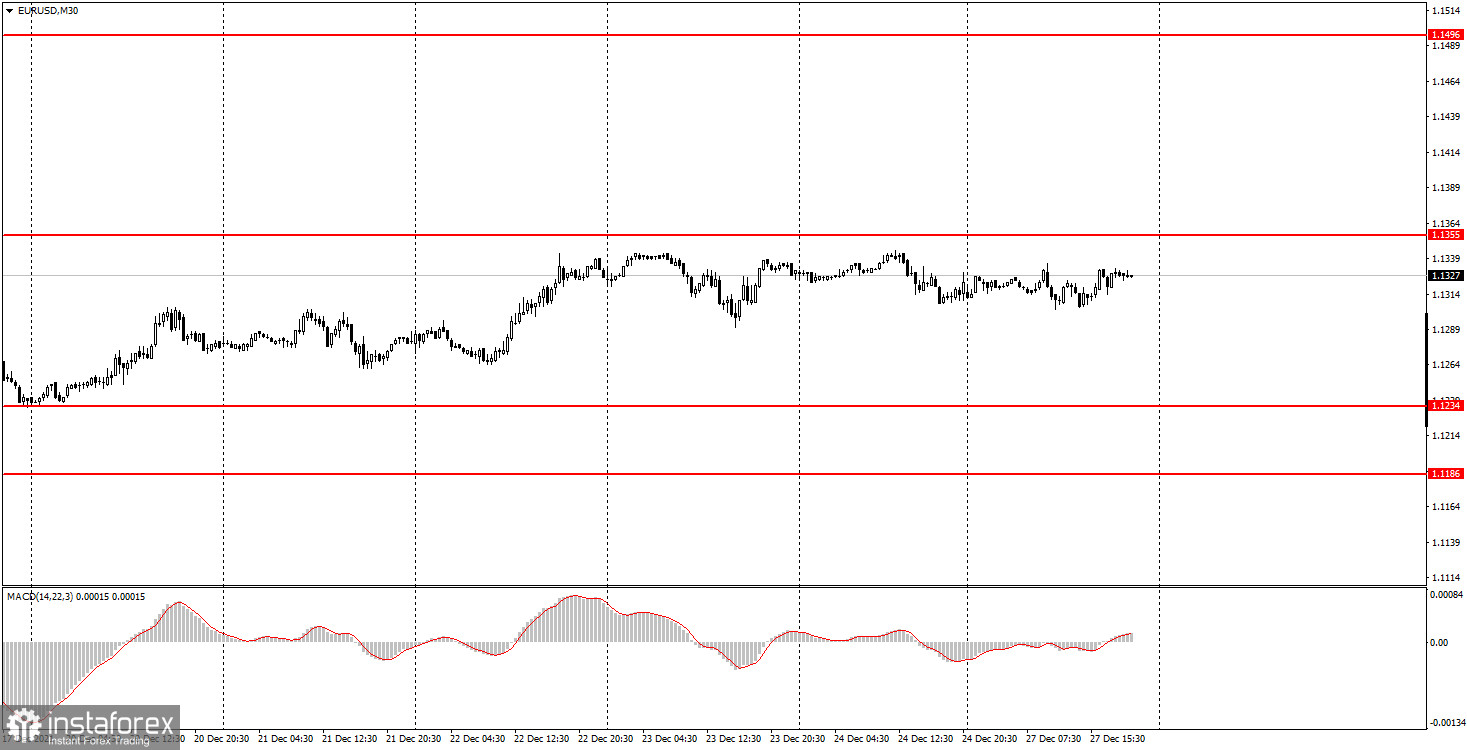
The EUR/USD pair continued to trade in a narrow price range on Monday. Not even in the 1.1234-1.1355 horizontal channel, but in the horizontal channel within the horizontal channel. For two days in a row, the volatility of the pair does not exceed 40 points, and the quotes are between the levels of 1.1302 and 1.1345. We have not applied these levels to the chart, as they will only complicate the analysis of the technical picture. In general, the pair continues to remain inside the horizontal channel, and this is the main thing. This means that the pair remains flat, and the markets do not find a compelling reason to actively trade the pair in the pre-holiday week. Needless to say, no macroeconomic statistics were published on Monday? There was also no fundamental background. There was also no movement of the pair. Thus, novice traders should clearly understand that now is not the best time to open any positions.
5M chart of the EUR/USD pair
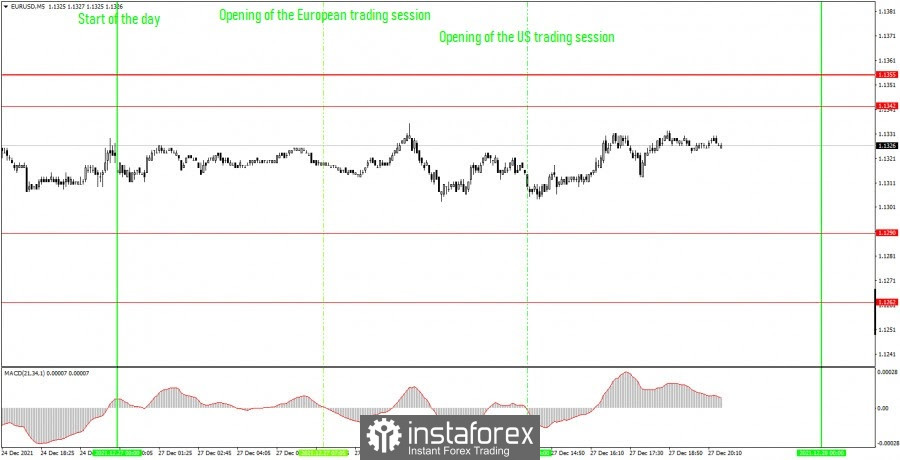
On the 5-minute timeframe, the pair's movements on Monday were as eloquent and boring as possible. In the chart above, you can clearly see that the price has been between the levels of 1.1290 and 1.1342 all day, without even trying to get close to any of them. Thus, not a single trading signal was generated on Monday. It is for the better, since many false signals could be formed with such a movement, which, of course, is not necessary for novice traders and traders in general. Thus, we can only draw conclusions that have already been drawn. You have to wait. Wait for the end of the holidays, wait for the end of the flat, wait for fundamental events, wait for macroeconomic reports. Most likely, all this will return to the market next year. However, in any case, we have a technical analysis and if something changes, beginners can always react quickly to changes.
How to trade on Tuesday:
On the 30-minute timeframe, the EUR/USD pair continues to be in the horizontal channel of 1.1234-1.1355. There was no rebound from the upper border of this channel, so a sell signal was not received. The pair can move as they please this week. Most likely, the movement will be within the channel, but even within the channel the movements can be as random as possible. The key levels on the 5-minute timeframe for December 28 are 1.1262, 1.1290, 1.1342-1.1355, 1.1422. Take Profit, as before, is set at a distance of 30-40 points. Stop Loss - to breakeven when the price passes in the right direction by 15 points. At the 5M TF, the target can be the nearest level if it is not too close or too far away. If it is, then you should act according to the situation or work according to Take Profit. No interesting report in the European Union or in America on Tuesday. There will be only a few minor ones, which are unlikely to somehow affect the course of trading.
Basic rules of the trading system:
1) The signal strength is calculated by the time it took to form the signal (bounce or overcome the level). The less time it took, the stronger the signal.
2) If two or more deals were opened near a certain level based on false signals (which did not trigger Take Profit or the nearest target level), then all subsequent signals from this level should be ignored.
3) In a flat, any pair can form a lot of false signals or not form them at all. But in any case, at the first signs of a flat, it is better to stop trading.
4) Trade deals are opened in the time period between the beginning of the European session and until the middle of the American one, when all deals must be closed manually.
5) On the 30-minute TF, using signals from the MACD indicator, you can trade only if there is good volatility and a trend, which is confirmed by a trend line or a trend channel.
6) If two levels are located too close to each other (from 5 to 15 points), then they should be considered as an area of support or resistance.
On the chart:
Support and Resistance Levels are the Levels that serve as targets when buying or selling the pair. You can place Take Profit near these levels.
Red lines are the channels or trend lines that display the current trend and show in which direction it is better to trade now.
The MACD indicator (14,22,3) consists of a histogram and a signal line. When they cross, this is a signal to enter the market. It is recommended to use this indicator in combination with trend lines (channels and trend lines).
Important speeches and reports (always contained in the news calendar) can greatly influence the movement of a currency pair. Therefore, during their exit, it is recommended to trade as carefully as possible or exit the market in order to avoid a sharp price reversal against the previous movement.
Beginners on Forex should remember that not every single trade has to be profitable. The development of a clear strategy and money management are the key to success in trading over a long period of time.


