Hi, dear traders!
Today is a quiet day on the economic calendar. More data will be released in the UK and the US later this week, with the main event being the US labor market data release, which is due on Friday. This week's data releases will largely determine the trajectory of GBP/USD.
Monthly

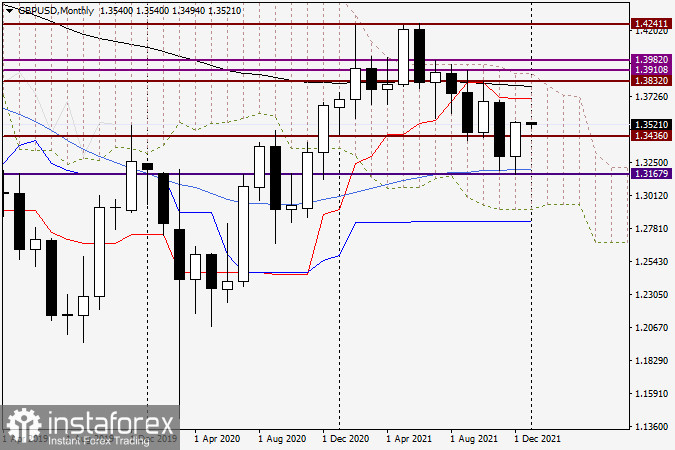
In December 2021, the pair went up significantly and closed at 1.3540, surpassing the important technical level of 1.3500. The strong support near 1.3168 and the 50-day SMA line at 1.3200 reversed the pair upwards. However, GBP/USD's further upside movement is uncertain. The pair remains within the Ichimoku cloud. The red Tenkan-Sen line near the technical level of 1.3700 and the black 89-day EMA line below 1.3800 are significant obstacles in its way. The shape of December's candlestick and its closing price suggests GBP/USD could continue to rise.
Weekly

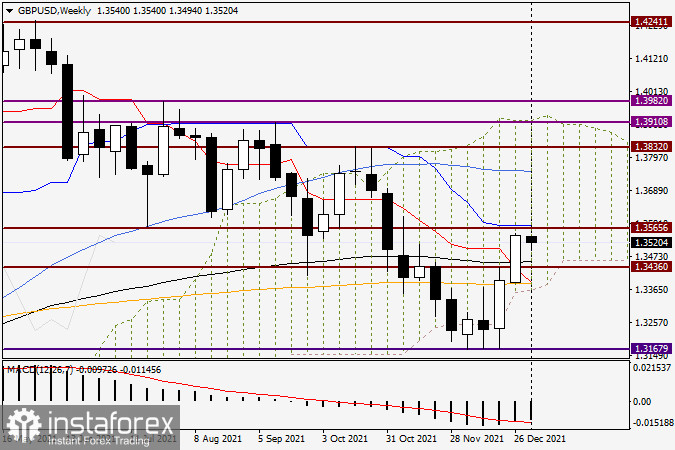
The weekly chart shows the pair is on the uptrend, largely thanks to its substantial increase last week. GBP/USD found strong support in the orange 200-day EMA line. The pair bounced off the 200-day EMA upwards, breaking through the red Tenkan-Sen line of the Ichimoku cloud and the black 89-day EMA in the process. Nevertheless, GBP/USD remains within the Ichimoku cloud and would encounter severe resistance at 1.3565 (its former support level, which was broken earlier), as well as the blue Kijun-Sen line at 1.3575. If the pair closes above the Kijun-Sen line, it could extend its upside movement. Currently, there are no clear opportunities for trading, and opening long positions below the above-mentioned resistance levels would be ill-advised. Traders could consider doing so once the pair retraces downwards.
Happy New Year!


