


Trend analysis (Fig. 1).
The market may move down on Tuesday from the level of 1.3475 (closing of yesterday's daily candle) to the target level of 1.3403, the 38.2% retracement level (red dotted line). When testing this level, the price may move upward to the target level of 1.3501, the 50.0% retracement level (yellow dotted line).
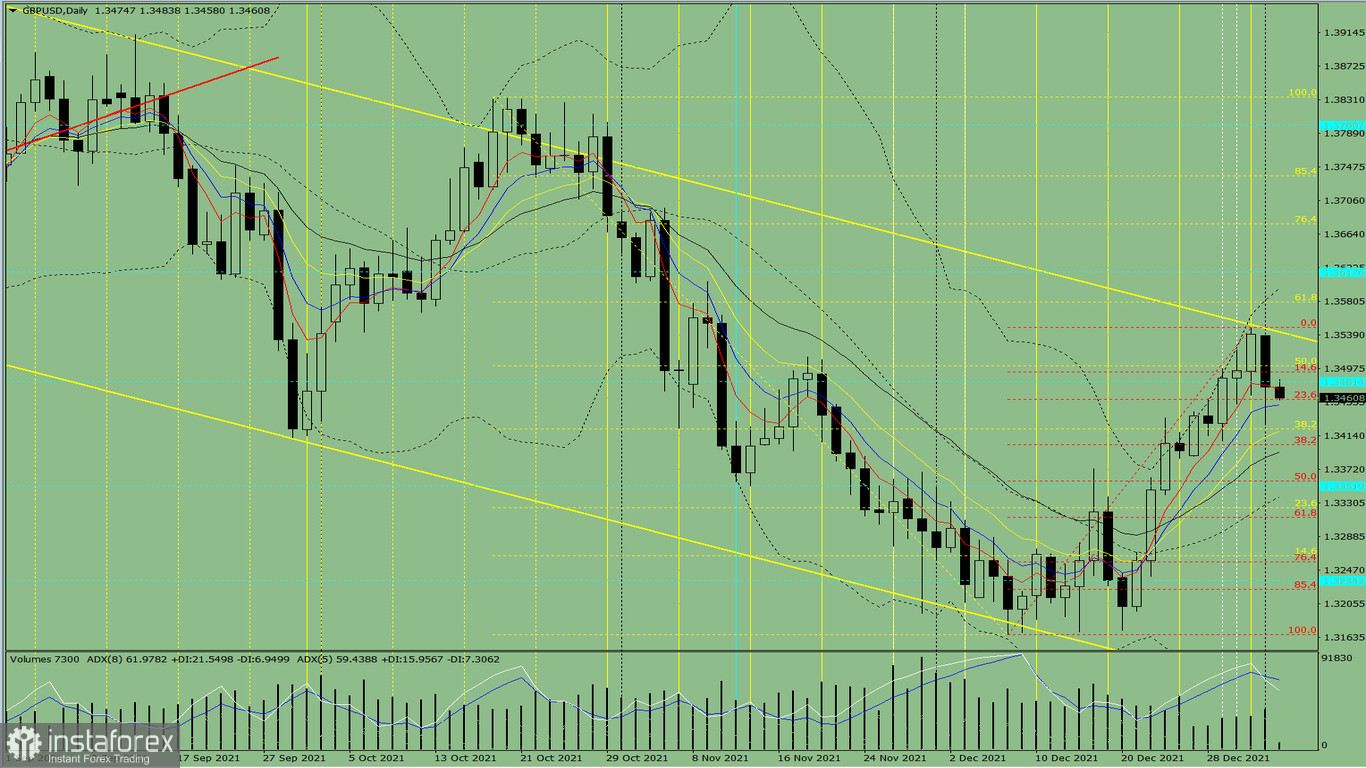
Fig. 1 (daily chart)
Comprehensive analysis:
- Indicator analysis - down;
- Fibonacci levels - down;
- Volumes - down;
- Candlestick analysis - down;
- Trend analysis - down;
- Bollinger lines - down;
- Weekly chart - down.
General conclusion:
The price may move down from the level of 1.3475 (closing of yesterday's daily candle) to the target level of 1.3403, the 38.2% retracement level (red dotted line). When testing this level, the price may move upward to the target level of 1.3501, the 50.0% retracement level (yellow dotted line).
Alternative scenario: from the level of 1.3475 (closing of yesterday's daily candle), the price may move down to the target level of 1.3430, the lower fractal (daily candle from 03/01/2022). When testing this level, the price may move upward.


