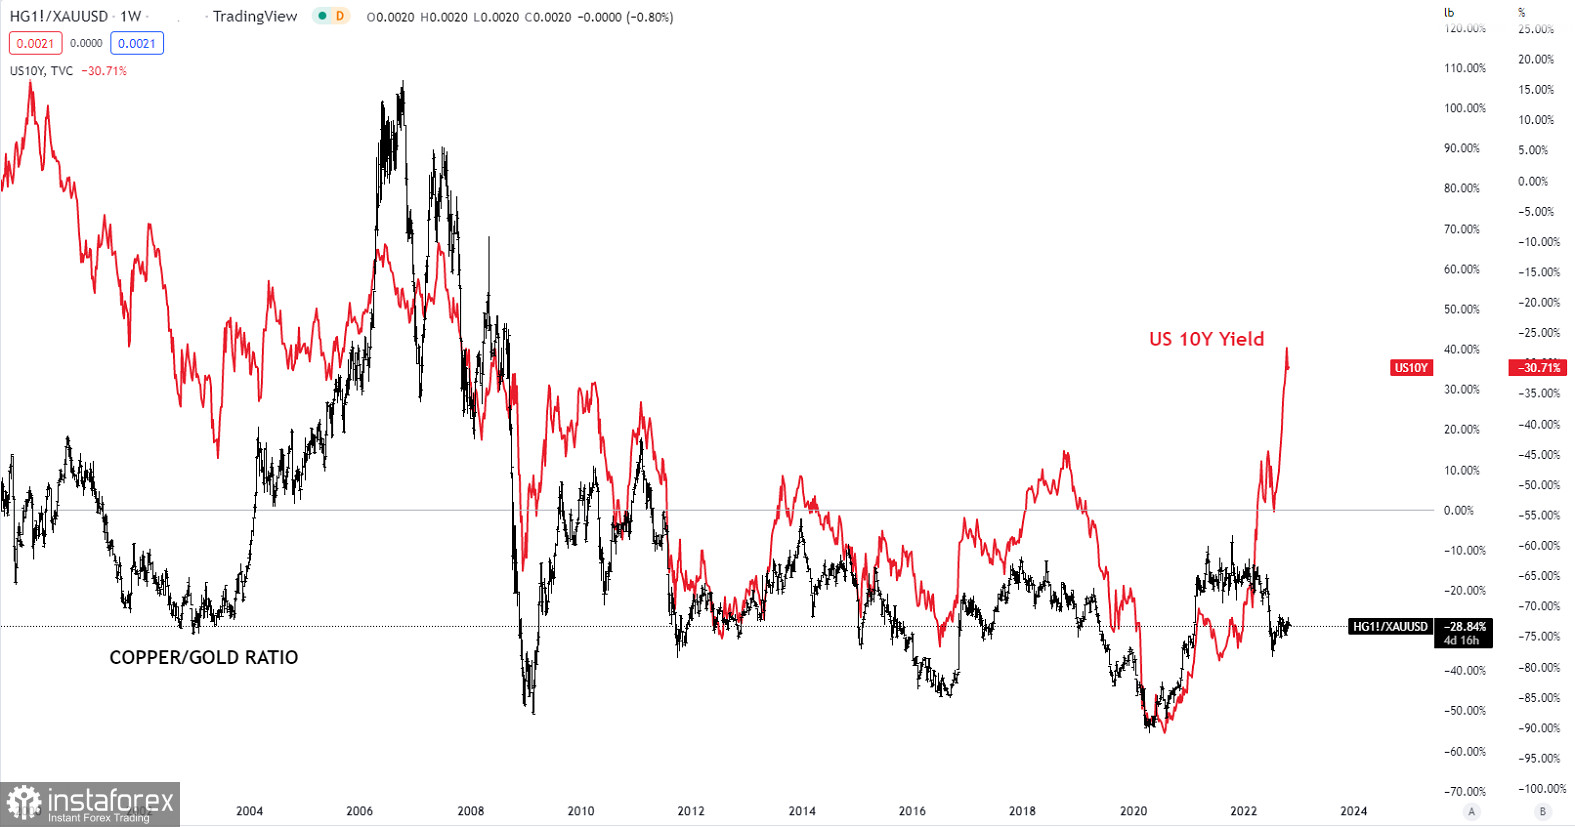
As inflation is biting in most of the world, we thought it could be interesting to look at the US 10Y yield as a proxy for the inflation pressure. In the chart above, we can see that the US 10Y yield follows the Copper/Gold ratio (Black line) very closely. Oftentimes, we see the Copper/Gold ratio peak or bottom a few weeks/months ahead of the US 10Y yield. Looking at the Copper/Gold ratio, it peaked back in October 2021 while the US 10Y yield has rallied strongly higher. Therefore, we think that a temporary setback in the US 10Y yield to 3.56 could be seen in the weeks/months ahead before a new swing higher towards 5.00 should be expected.


