EUR/USD
Analysis:
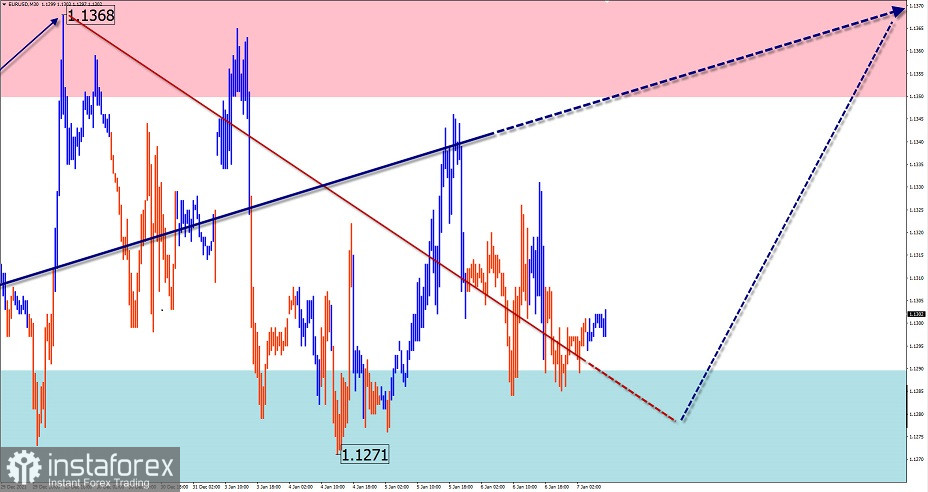
A correction is building at the end of the descending wave that was formed on the euro last year. It is currently lacking the final section in its structure. At the moment of writing, the amplitude of this wave is not sufficient to start a reversal.
Outlook:
A sideways movement is likely to continue over the next 24 hours. After short-term pressure on the support zone, we can expect a change in the trend and a price movement towards the resistance zone. A breakout of its upper boundary is possible today but is very unlikely.
Potential reversal zones
Resistance:
- 1.1350/1.1380
Support:
- 1.1290/1.1260
Recommendations:
Trading in the euro market can be profitable today only within individual trading sessions with a reduced lot size. Selling opportunities will appear after clear reversal signals emerge near the resistance zone.

USD/JPY
Analysis:
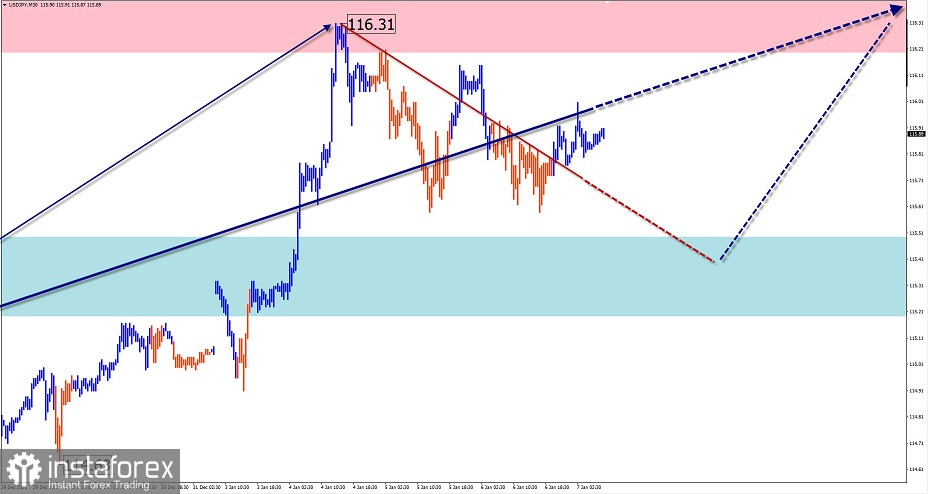
The ascending wave of the Japanese yen brought the quotes to the levels last seen five years ago. The bullish pressure of recent days has broken the upper line of the strong resistance zone on a higher timeframe. Before resuming its growth, the pair must complete the phase of correction.
Outlook:
Over the next 24 hours, the price is expected to move within the sideways channel between the opposite zones. The upper boundary of the previous resistance zone will become a new strong level of support.
Potential reversal zones
Resistance:
- 116.20/116.50
Support:
- 115.50/115.20
Recommendations:
Trading the yen is possible today only with fractional lots on the daily chart. Selling can be risky today. It is better to refrain from entering the market during the upcoming decline and to track buy signals near the support zone.

GBP/JPY
Analysis:
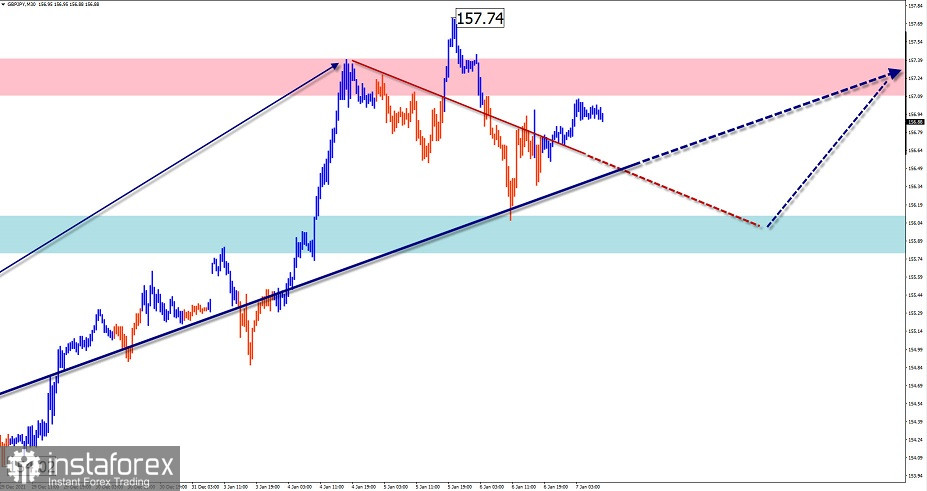
On the chart of the GBP vs JPY cross rate, we can see an ongoing descending wave which dates back to October 20, 2021. The ascending section of the trend from November 26 has not yet left the correctional channel. By now, the price has reached a strong zone of resistance on a bigger timeframe. Further uptrend will change the current wave layout.
Outlook:
The price is likely to enter a sideways channel in the next 24 hours. In the first half of the day, the resistance zone may come under pressure. It is highly likely that the quotes will reverse and start a downward movement in the course of the North American session.
Potential reversal zones
Resistance:
- 157.10/157.40
Support:
- 156.10/155.80
Recommendations:
Currently, there are no conditions for buying the pair today. Short-term sales are possible with fractional lots in individual trading sessions. It is advisable to refrain from opening new positions on an upcoming pullback and to track the emerging buy signals when the pullback ends.

GOLD
Analysis:
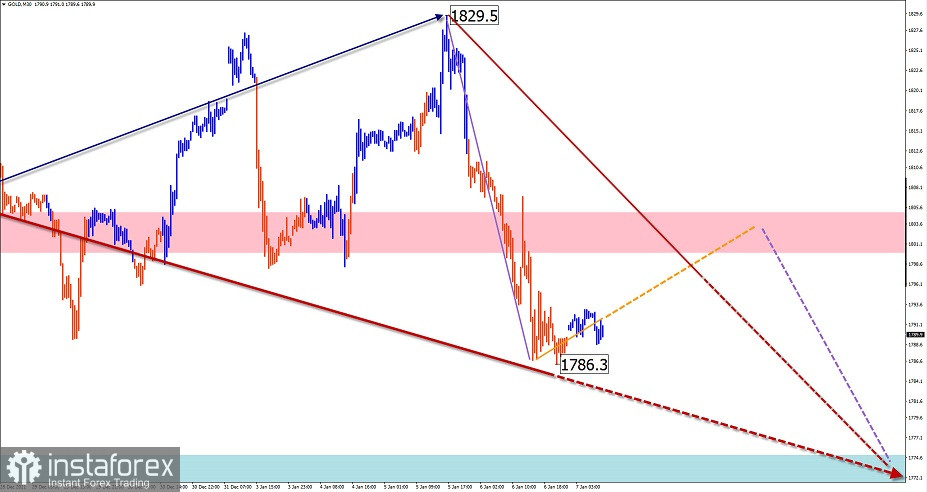
Since March last year, gold has been moving sideways, and now it is forming a shift to an ascending line. The unfinished section of the trend from November 23 is gaining its wave amplitude within this sideways channel. The price has been pulling back lately.
Outlook:
In the coming sessions, gold is expected to move from the upper to the lower boundary of the current price channel. In the European session, a short-term rise to the resistance zone is possible.
Potential reversal areas
Resistance:
- 1800.0/1805.0
Support:
- 1775.0/1770.0
Recommendations:
Selling in the gold market is quite risky today and may result in losses. It is better not to enter the market until the current pullback is completed. The emerging buy signals should be tracked near in the support area.

Explanations: In simplified wave analysis (SWA), waves consist of 3 parts (A-B-C). We analyze the last unfinished wave. The solid arrow background shows the structure that has been formed. The dashed lines show the expected movements.
Note: The wave algorithm does not take into account the duration of the instrument's movements over time!


