


The basic trend of EUR/USD pair is neutral, and the short term is tentatively bearish. With such a pattern, it is difficult to favour buying or selling. The first support is located at 0.9706. The first resistance is located at the level of 0.9798.
However, the probabilities of moving towards the first support before the first resistance are slightly higher. Without a basic trend, it is important to monitor the price response at these levels.
A bearish break in the support or a bullish break in the resistance could provide a signal that would set the new direction of the basic trend.
On the other hand, if the price is blocked by support or resistance, it could be attractive to trade against the trend on the last short-term movement recorded by EUR/USD pair.
Technical indicators are bearish in the very shrot term and could soon allow change to a bearish sentiment. Bearish range between the levels of 0.9600 and 0.9854.
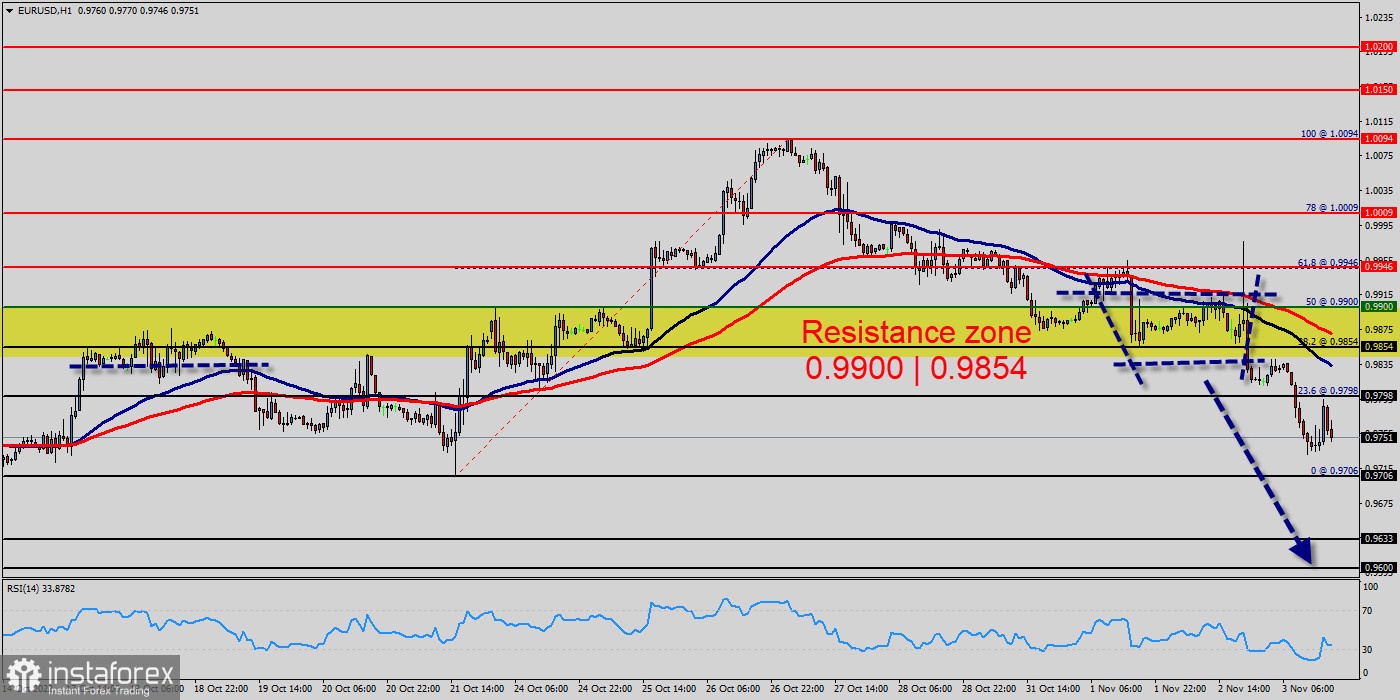
The EUR/USD pair faced resistance at the level of 0.9854, while minor resistance is seen at 0.9798. Support is found at the levels of 0.9706, 0.9633 and 0.9600.
Also, it should be noted that a daily pivot point has already set at the level of 1.1836. Equally important, the EUR/USD pair is still moving around the key level at 0.9854, which represents a daily pivot in the H1 time frame at the moment.
The EUR/USD pair continues to move downwards from the areas of 0.9900 and 0.9854. Yesterday, the pair dropped from the level of 0.9900 which coincides with a ratio of 50% Fibonacci on the H1 chart to 0.9753.
Today, resistance is seen at the levels of 0.9854 and 0.9900. So, we expect the price to set below the strong resistance at the levels of 0.9900 and 0.9854; because the price is in a bearish channel now. The RSI starts signaling a downward trend.
Consequently, the market is likely to show signs of a bearish trend. Thus, it will be good to sell below the levels of 0.9900 or/and 0.9854. Amid the previous events, the price is still moving between the levels of 0.9854 and 0.9600 in coming hours.
Always, we use the time frame of H1 to determine the lower and the higher price of yesterday, because it is more precise. Moreover, we use the hourly time frame with a view to determine the lower and the higher price of last week.
In overall, we still prefer the bearish scenario as long as the price is below the level of 0.9854. Furthermore, if the EUR/USD pair is able to break out the bottom at 0.9706, the market will decline further to 0.9633 (daily support 2).
The price will fall into a bearish trend in order to go further towards the strong support at 0.9600 to test it again. The level of 0.9600 will form a new double bottom.
Otherwise, if the price closes above the strong resistance of 0.9854, the best location for a stop loss order is seen above 0.9900. So long as the invalidation level of this analysis is not breached (0.9900), the bearish direction is still favored, however the current short term correction should be carefully watched. The bulls must break through 0.9900 in order to resume the up trend.


