EUR/USD

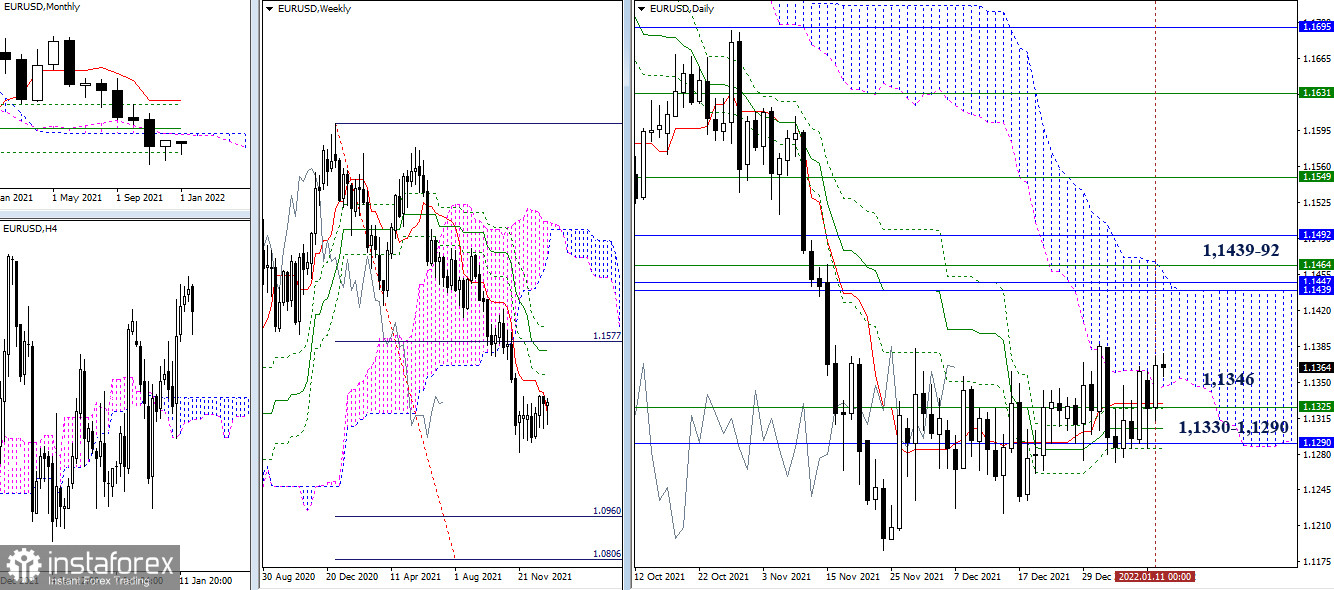
The bulls managed to close yesterday's trading day in the daily cloud. So after updating the consolidation high (1.1387), the path will open towards the next accumulation of resistances, whose breakdown will indicate new prospects and opportunities. The accumulation of resistances, forming the current upward targets, is set around 1.1439-92 (monthly levels + weekly Fibo Kijun + upper border of the daily cloud). The nearest support is the lower border of the daily cloud (1.1346), while subsequent support remains in the 1.1325-1.1290 area (weekly short-term trend + daily cross + monthly level).

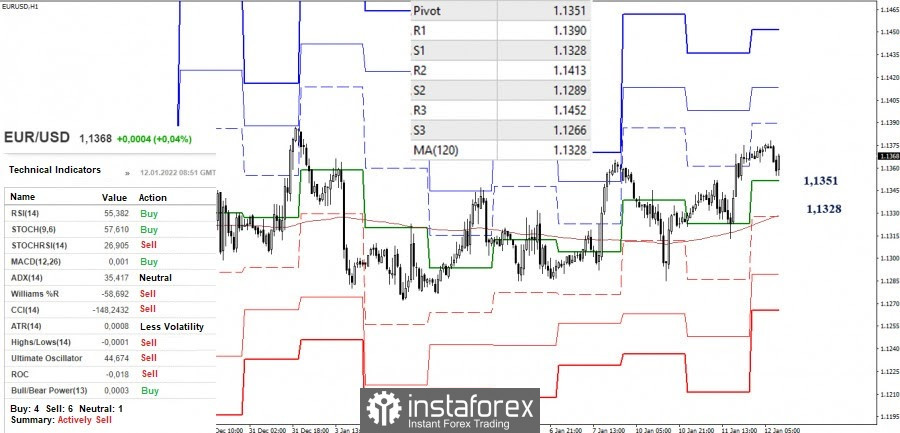
There is currently a downward correction on the hourly timeframe. Today's nearest pivot points to test and develop the correction are the key levels in the smaller timeframes, namely 1.1351 (central pivot level) and 1.1328 (weekly long-term trend). In turn, the formation of a rebound from the support levels can return the relevance to upward targets, which are the classic pivot levels at 1.1390 - 1.1413 - 1.1452. A consolidation below the key levels (1.1351-28) can affect the distribution of forces and change the priorities towards strengthening the bearish mood.
GBP/USD

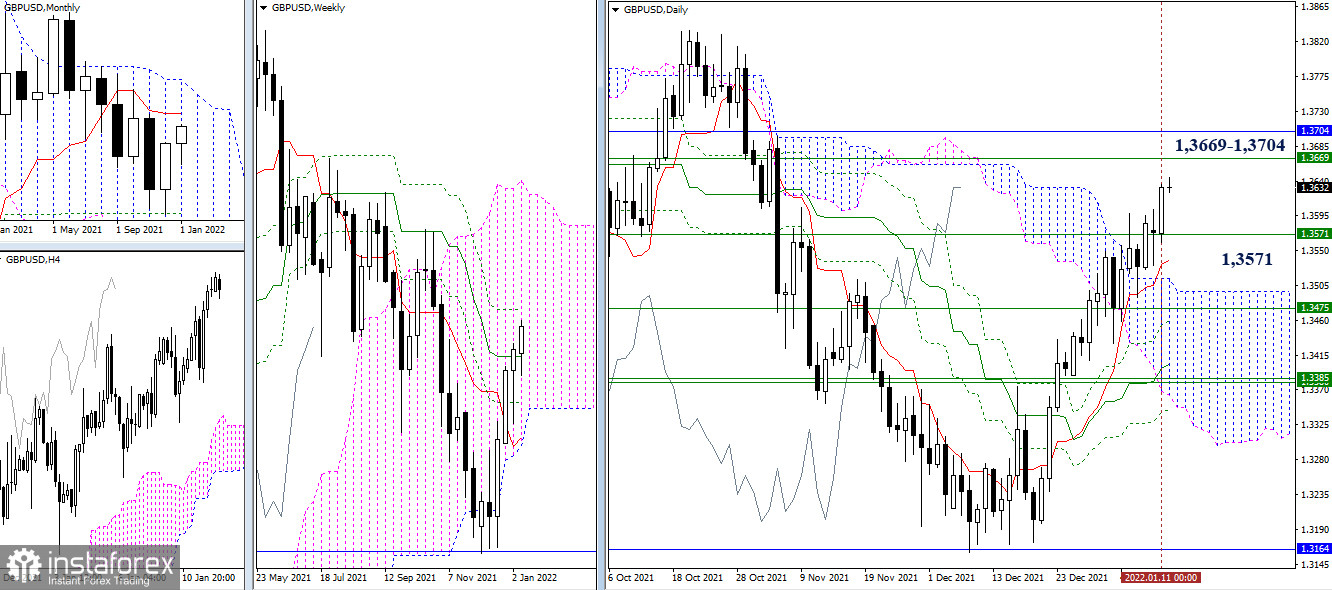
The upward movement persists. The closest upward target to be tested is in the area of 1.3669 (weekly Fibo Kijun) - 1.3704 (monthly Tenkan). After forming the result of the interaction, possible prospects can be considered. The weekly medium-term trend (1.3571) remains the nearest support level.

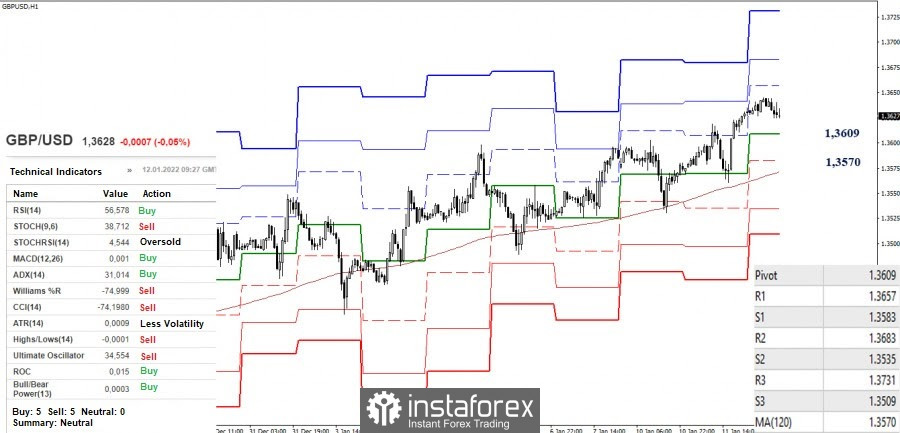
The main advantage in the smaller timeframes is still on the side of the bulls, whose intraday upward pivot points are located at 1.3657 - 1.3683 - 1.3731 (classic pivot levels). Meanwhile, the key supports are found at 1.3609 (central pivot level) and 1.3570 (weekly long-term trend). In the event of a downward correction, testing, and breakdown of key supports, the current balance of forces may change. After that, the situation will be reevaluated. The next intraday supports here will be the classic pivot levels of 1.3535 - 1.3509.
***
Ichimoku Kinko Hyo (9.26.52) and Kijun-sen levels in the higher time frames, as well as classic Pivot Points and Moving Average (120) on the H1 chart, are used in the technical analysis of the trading instruments.


