To open long positions on GBP/USD, you need:
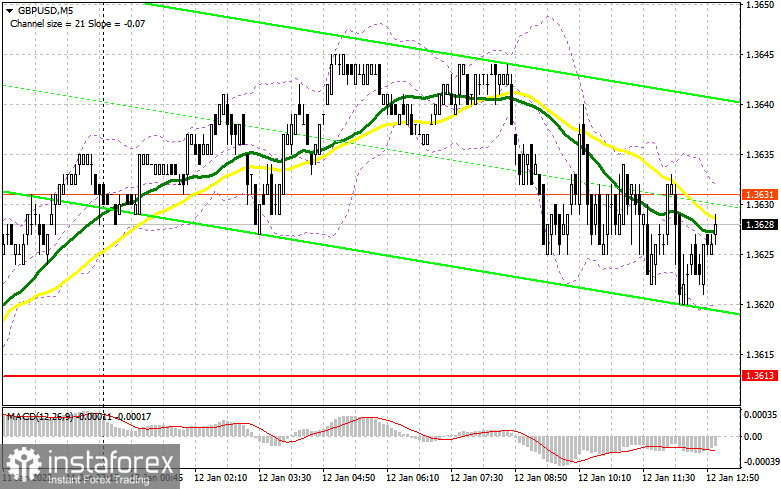
In my morning forecast, I paid attention to the level of 1.3613 and recommended making decisions on entering the market. Let's take a look at the 5-minute chart and figure out the entry points. Due to the very low trading volume and volatility, we did not wait for the test of the nearest support level of 1.3613. In this regard, it was not possible to get signals to enter the market. The lack of important fundamental statistics is also one of the reasons why the pound is marking time. From a technical point of view, nothing has changed for the second half of the day. And what were the entry points for the euro this morning?

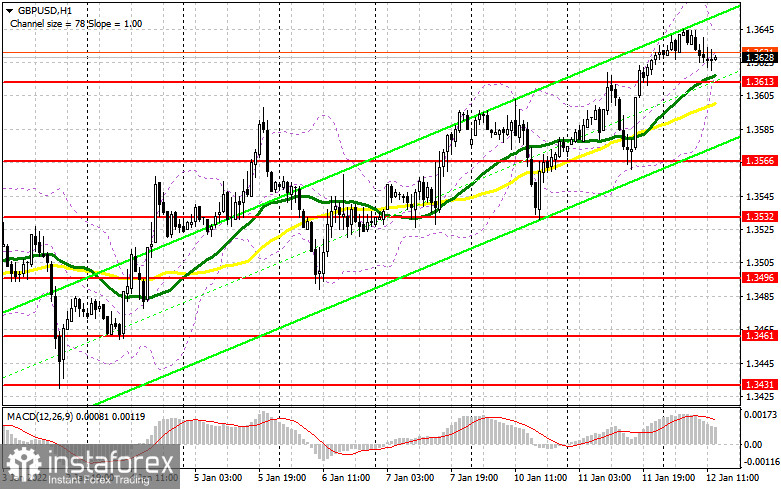
The primary task of buyers for today is to protect the support of 1.3613, which was formed following the results of yesterday. At this level, there are moving averages playing on the side of the bulls, which should also help the buyers of the pound to cope with the pressure. The formation of a false breakdown at 1.3613 forms a buy signal with the prospect of continuing the bull market aimed at updating the new resistance of 1.3664. A breakdown and test of this level from top to bottom will give an additional entry point and strengthen the position of buyers to continue the growth of GBP/USD to the highs: 1.3710 and 1.3754. A more distant target will be the 1.3793 area, where I recommend fixing the profits. However, this level will be available only with very weak inflation in the US in December this year. In the scenario of a decline in the pound during the US session and a lack of activity at 1.3613, it is best to postpone purchases to the level of 1.3566, from where it was possible to observe more aggressive actions of bulls yesterday. To miss this area is tantamount to missing the initiative. Only the formation of a false breakdown there at 1.3566 will give an entry point in the expectation of further recovery of GBP/USD. You can buy the pound immediately on a rebound from 1.3532, or even lower - from a minimum of 1.3493, counting on a correction of 20-25 points within the day.
To open short positions on GBP/USD, you need:
Bears have nothing so serious to offer so far to influence the bullish trend. Thank you for at least not being allowed to update the next monthly highs during European trading. Today's inflation in the United States may change the situation, but this is unlikely. Most likely, it will not go beyond the forecasts of economists, which will allow the Fed to pursue a less aggressive policy, as Jerome Powell said yesterday. The primary task for today remains to protect the resistance of 1.3664, as the pair's exit above this range will create several technical problems and lead to the continuation of the bullish trend. In the afternoon, a representative of the Bank of England will also speak, which may shake the market a little if it touches on the topic of interest rates. The formation of a false breakdown at the level of 1.3664 forms the first entry point into short positions, followed by a decline in the pair to the area of 1.3613, for which you will have to fight hard since there are also moving averages playing on the side of the bulls. A breakdown of 1.3613 and a reverse test from the bottom up will increase pressure on the pound and dump it to the next support of 1.3566. Only the consolidation and the reverse test of 1.3566 from the bottom up will give a new entry point into short positions with the prospect of a decline in GBP/USD by 1.3532 and 1.3496, where I recommend fixing the profits. If the pair grows during the American session and sellers are weak at 1.3664, it is best to postpone sales to a larger resistance of 1.3710. I also advise you to open short positions there only in case of a false breakdown. It is possible to sell GBP/USD immediately for a rebound from a large resistance of 1.3754, or even higher - from a new maximum in the area of 1.3793, counting on the pair's rebound down by 20-25 points inside the day.

The COT reports (Commitment of Traders) for January 4 recorded a sharp increase in long positions and a reduction in short positions - which indicates an increase in the attractiveness of the pound after the Bank of England raised interest rates at the end of last year. If you look at the overall picture, the prospects for the British pound look pretty good. The Bank of England's decisions continues to support buyers of risky assets in the expectation that the regulator will continue to raise interest rates this year, which will make the pound even more attractive. High inflation remains the main reason why the Bank of England will continue to tighten its monetary policy. On the other hand, the US dollar also has support: inflation data in the US are expected this week, which, together with the recent report on the US labor market, will certainly force the Federal Reserve System to act more aggressively. The first interest rate hikes are planned in the spring, which will make the US dollar more attractive. The COT report for January 4 indicated that long non-commercial positions rose 20,824 to the level of 25,980, while short non-commercial positions fell from the level of 78,510 to the level of 65,151. This led to a serious change in the negative non-commercial net position from -57,686 to -39,171. The weekly closing price rose from 1.3209 to 1.3482.
Signals of indicators:
Moving averages
Trading is conducted above 30 and 50 daily moving averages, which indicates the continuation of the pound's growth further along with the trend.
Note: The period and prices of moving averages are considered by the author on the hourly chart H1 and differ from the general definition of the classic daily moving averages on the daily chart D1.
Bollinger Bands
A breakthrough of the upper limit of the indicator in the area of 1.3645 will lead to a new wave of growth of the pound. A breakthrough of the lower limit of the indicator in the area of 1.3610 will increase the pressure on the pound.
Description of indicators
- Moving average (moving average determines the current trend by smoothing out volatility and noise). Period 50. The graph is marked in yellow.
- Moving average (moving average determines the current trend by smoothing out volatility and noise). Period 30. The graph is marked in green.
- MACD indicator (Moving Average Convergence / Divergence - moving average convergence/divergence) Fast EMA period 12. Slow EMA period 26. SMA period 9
- Bollinger Bands (Bollinger Bands). Period 20
- Non-profit speculative traders, such as individual traders, hedge funds, and large institutions that use the futures market for speculative purposes and meet certain requirements.
- Long non-commercial positions represent the total long open position of non-commercial traders.
- Short non-commercial positions represent the total short open position of non-commercial traders.
- Total non-commercial net position is the difference between the short and long positions of non-commercial traders.


