GBP/USD 5M

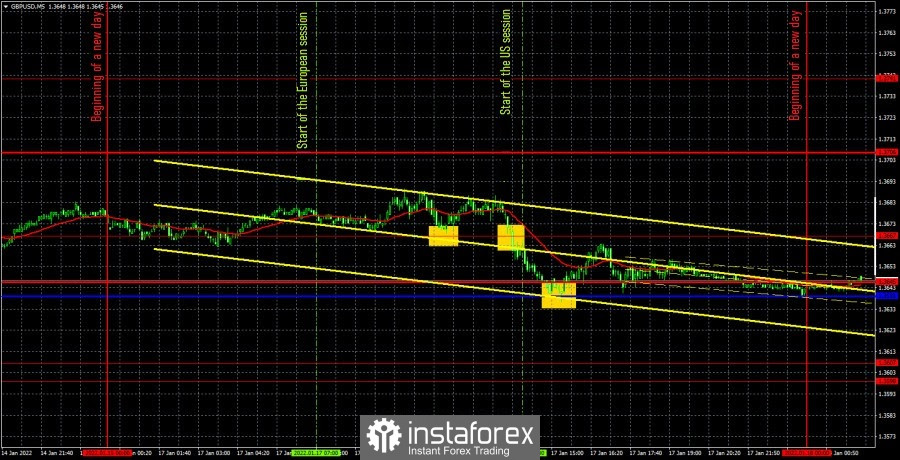
The GBP/USD pair also showed nothing interesting on Monday. It traded almost identical to the EUR/USD pair during the day. Thus, the difference was only in the extreme levels, near which the price was. Bulls tried to "stay in business" and maintain the upward trend in the first half of the day, the prospects of which were seriously shaken on Friday. However, given the absolutely empty calendar of macroeconomic events, it was difficult for them to do this. The bears tried to break the "bullish" trend for most of the day, and the bulls recorded profits on monthly transactions. Nevertheless, it cannot be said that the initiative was entirely in the bears' hands. The pair rebounded from the extreme level of 1.3667 during the European trading session, forming a buy signal. It was possible to earn about 10 points of profit on it, which is very little. But given the overall volatility of the day, equal to 50 points, such profit levels are not surprising at all. Closer to the US session, the bears increased their pressure and managed to settle below the level of 1.3667 and traders could already open short positions here. As in the case of the European currency, the movement at this time turned out to be the strongest during the day. The pound went down about 50 points in total, but the signal was formed halfway, so it was possible to earn a maximum of 15 points on it. The rebound from the critical line should have served as a signal to shorten the shorts and, possibly, to open new longs. Although since there was no "foundation" and "macroeconomics" on Monday, it was not necessary to expect a sharp change in the mood of traders. Consequently, it could be concluded that the bulls are weak and long positions can no longer be opened. However, it was possible to earn up to 10 more profit points on long positions. This style of trading, which the pair forced us to do on Monday, is not the best thing to do. However, what can you do if the pair passes 50 points in a day and changes direction several times at the same time?
We recommend to familiarize yourself with:
Overview of the EUR/USD pair. January 18. Why does the EU not want to raise the key rate?
Overview of the GBP/USD pair. January 18. The issue of Boris Johnson's resignation for the first time in 2.5 years is on the agenda
Forecast and trading signals for GBP/USD on January 18. Detailed analysis of the movement of the pair and trading transactions.
COT report

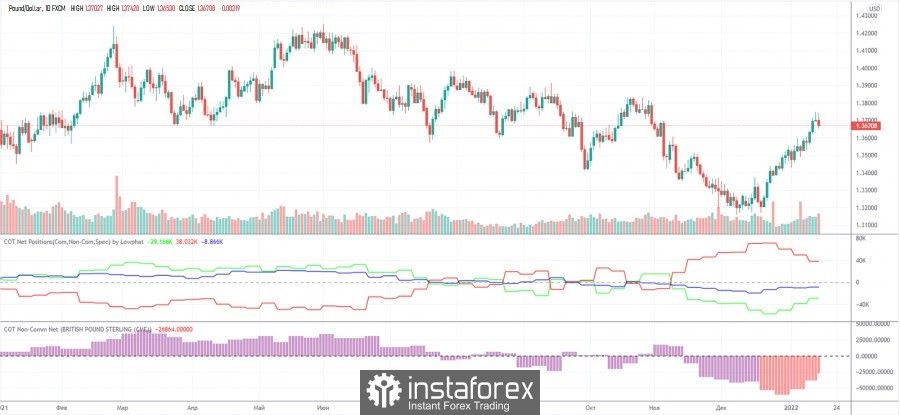
Recall the situation with Commitment of Traders (COT) reports on the euro currency. The picture with the British pound is exactly the opposite. Here, the green and red lines (indicating the net positions of non-commercial and commercial traders) have moved away from each other a couple of weeks ago, which is a signal of the possible end of the trend. That's exactly what happened. At the moment, these lines are converging, so we believe that the upward momentum of the British pound has not been exhausted. The mood of professional traders remains bearish, but at the same time, the trend should be taken into account here. And the trend now is to reduce the difference between the two categories of players. In other words, the bearish mood is weakening. Thus, we believe that after a slight pullback downwards, the growth of the British currency will resume.
GBP/USD 1H

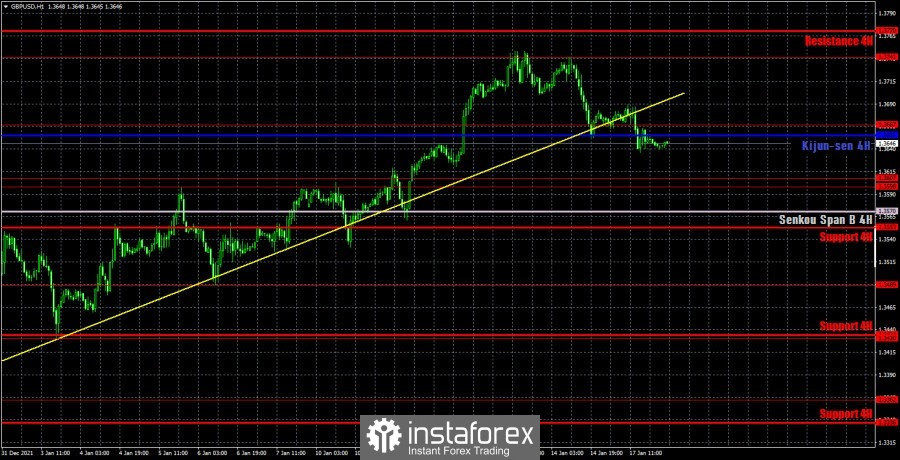
The pound/dollar pair moved much more significantly on the hourly timeframe. The price has finally confidently overcome the ascending trend line, so now the chances of forming a new downward trend are 80 percent. Moreover, the pound has been growing for almost a month and now a correction is needed. Thus, we believe that the pair is able to go down another 100-150 points in the next few days. However, a lot will depend on macroeconomic statistics, which are enough in the UK this week. Nevertheless, no one canceled the technical signals, and overcoming the critical line will only increase the likelihood of a further fall in the pound. We highlight the following important levels on January 18: 1.3489, 1.3598-1.3607, 1.3667, 1.3741. The Senkou Span B (1.3570) and Kijun-sen (1.3655) lines can also be signal sources. Signals can be "bounces" and "breakthroughs" of these levels and lines. It is recommended to set the Stop Loss level to breakeven when the price passes in the right direction by 20 points. The lines of the Ichimoku indicator can move during the day, which should be taken into account when determining trading signals. On Tuesday, the UK is scheduled to publish the unemployment rate, the number of applications for unemployment benefits, as well as the level of average earnings. We cannot say that these reports will absolutely provoke a strong movement or at least a reaction. In general, the market rarely reacts to unemployment, considering that there are other more significant indicators of the state of the economy. At the same time, you should not miss these reports, especially since they will be released at the same time. But nothing interesting is planned for Tuesday in the United States, so we believe that volatility will remain low today, and the movements will be similar to those observed on Monday.
Explanations for the chart:
Support and Resistance Levels are the levels that serve as targets when buying or selling the pair. You can place Take Profit near these levels.
Kijun-sen and Senkou Span B lines are lines of the Ichimoku indicator transferred to the hourly timeframe from the 4-hour one.
Support and resistance areas are areas from which the price has repeatedly rebounded off.
Yellow lines are trend lines, trend channels and any other technical patterns.
Indicator 1 on the COT charts is the size of the net position of each category of traders.
Indicator 2 on the COT charts is the size of the net position for the non-commercial group.


