


Hello, dear colleagues!
In this article, we will discuss the outlook for the cryptocurrency market in the context of investors' risk appetite, conduct cross-market technical analysis and identify key levels of related assets that affect the bitcoin exchange rate
What can the cryptocurrency market, corporate bonds and the Nasdaq100 index have in common? This common feature is obvious. It is the US dollar, which is the denominator for cryptocurrencies. Cryptocurrencies can be widely quoted on the market, however, fiat money remains the basis of their value and the US dollar is the basis of fiat currencies.
Besides, the US dollar is subject to the US Federal Reserve's policy, investors' appetite for risks, inflation, oil prices and many other factors, which are very difficult to take into consideration and formalize. However, as for the graphical picture, these factors can be considered in the technical analysis, obtaining the necessary data to make decisions.
Before analyzing the intermarket relationships of cryptocurrency rates, it is necessary to identify the common features of these assets. The key point is investors' risk appetite, as well as the cost of credit. It is recommended to use analysis of high-yield US corporate bonds to assess investor's risk appetite. The higher the price, the lower the yield. High-yield bonds rise when investors are risk-takers and decline when investors are risk-averse and leave the market.
As an example, let's analyze the SPDR Barclays High Yield Bond ETF JNK, an exchange-traded fund that invests in high-yield US corporate bonds (Figure 1). Observing the 3-Line-Break chart, it is easy to notice that this fund was rising throughout 2021, which means investors' appetite for risk was increasing. However, the situation changed in the fall, and in November investors began to leave the JNK fund. After the price broke the lows of 106.923 and 106.557, the uptrend in which fund units had been since 2020 ended. In December, corporate bonds started rising again in the short term and even tried to renew the highs and continue the trend. However, in January 2022 these attempts ended with a sell-off, indicating that investors are not willing to admit possible risk of defaults. Overall, currently they are inclined to wait out and see how events develop further. Meanwhile, the growth of JNK fund units above the high of 108.840 will mean that investors are again inclined to invest in risky assets. Conversely, a decline in JNK below November's low of 105.898 would signal the start of a dramatic sell-off and investors' urge to invest into safe-haven value assets.
Besides, if 3-Line-Break charts are new to you, I recommend you to examine this price display format carefully. It helps to filter market noise and visualize the technical picture well. Apart from the traditional display of prices in bars and candlesticks, this system is beneficial to identifying reversals and directions of corrections and trends.
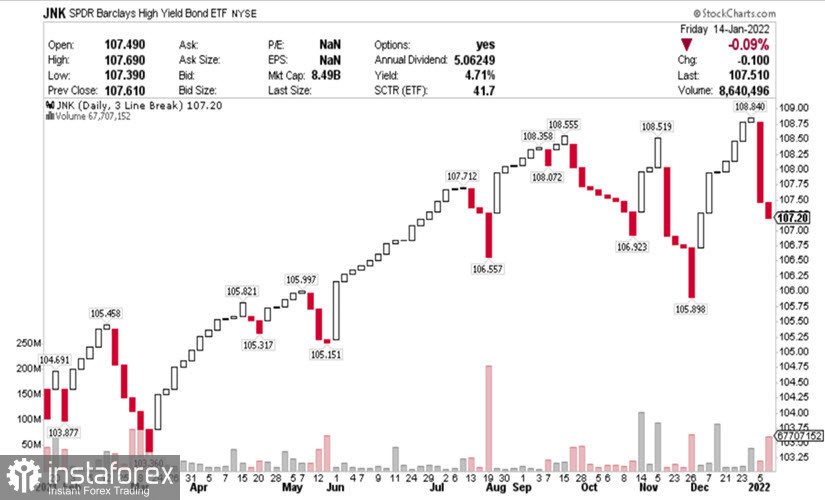
Fig.1: Technical picture of daily time frame of SPDR Barclays High Yield Bond ETF JNK
Additional notes should be given for our readers. The fact is that investors' lack of risk appetite is always characterized by the dollar's rise. Besides, as mentioned above, bitcoin has the dollar in its denominator, which leads to a decrease in its value if the dollar grows.
Another dollar's positive aspect is discounted cash flows: the higher the yield of the US Treasury bonds is, the more attractive investments in the US market are, the higher demand for dollars and correspondingly higher its rate is. At the same time, currently the money is flowing from growth assets into value assets within the market. This process is clearly described by the stock indices comparing the Nasdaq and the SP500, with the index of high-tech companies looking weaker than the index of the broad market.
High inflation and the Fed's policy were the reasons why investors demanded a large premium from the government in the second half of 2021, leading to a rise in US government Treasury bond yields. Besides, as the chart shows, the yield on the 10-year bond, the benchmark for most of the credit, has surpassed the level of 1.69%. Bond yields have been actively growing since August 2021, noticeably strengthening the dollar and weakening the positions of its rivals (fig. 2). Moreover, the chart clearly shows that there was a classic breakout of the resistance line with confirmation at the beginning of 2022. This fact indicates a further increase in bond yields and thus an even greater dollar's appeal as a currency.
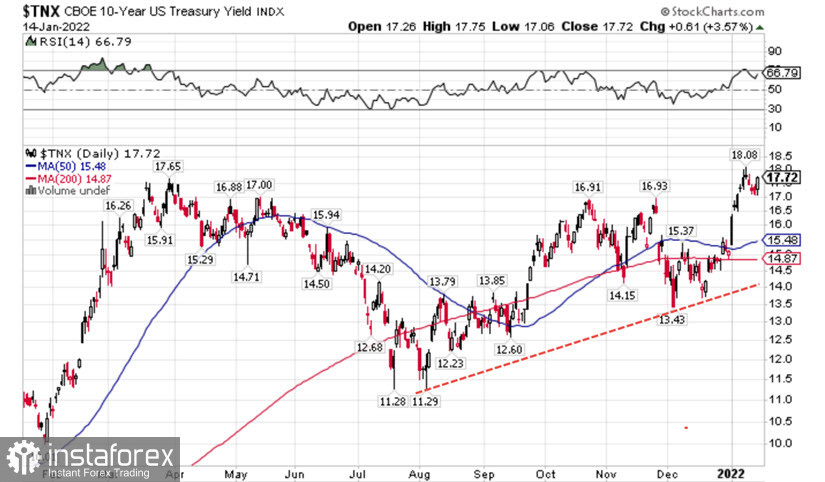
Fig.2: 10-year US government treasury bond's yield
Finally, it is time to add a key cross-market element, the Nasdaq 100 stock index to our analysis. This index shows the aggregate value of the 100 largest companies in the high-tech sector weighted by capitalization. Bitcoin is closely linked to modern technologies. However, at the same time both bitcoin and high-tech companies depend on investors' inclination to high-risk investments. Therefore, the Nasdaq100 index can be a target for the price dynamics of BTC/USD. Moreover, Charles Dow argued that indexes must confirm each other. Therefore, breakouts and significant reversals on bitcoin and other cryptocurrencies can be confirmed.
Let's observe the technical picture of the Nasdaq100 $NDX index. As for the chart on January 10, 2022, $NDX broke the key support at 15500 and fell to a low of 15165. However, it failed to consolidate under the support and is currently at 15611 (Fig. 3). This position of the index raises the question: was it a true breakout or a false one? At the same time, the fact that the Nasdaq100 index is below the level of the quarterly average line and negative indicators of MACD technical indicator makes further decrease more probable than resumption of its growth.
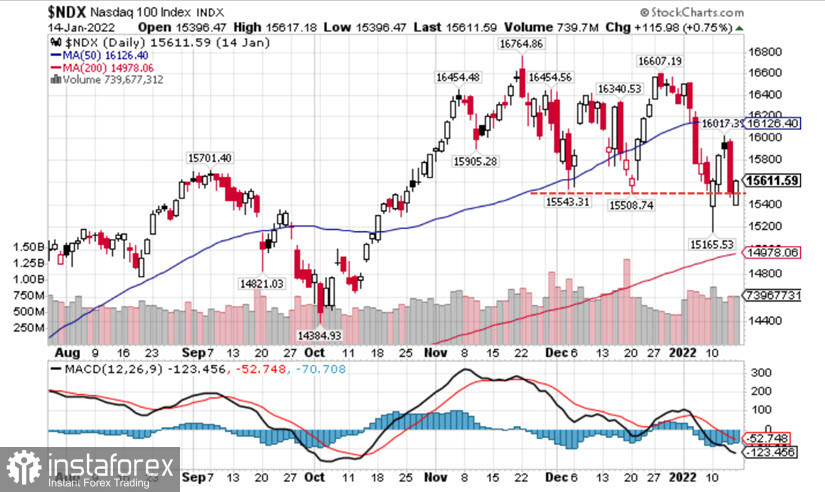
Fig.3: Technical picture of Nasdaq100 index
In conclusion, let's summarize. From the point of view of intermarket technical analysis, the markets are currently experiencing capital outflow from higher risk assets to more reliable value assets. The capital outflow is confirmed by the dynamics of the declining price of high-yield corporate bonds JNK, rising yields of government treasury bonds and attempts to decrease the Nasdaq100 index. Taking into account the combination of these factors, it is possible to assume that bitcoin will be under pressure and is most likely to decline in the coming months.
Notably, the decline in the cryptocurrency market is not predetermined and can be confirmed or refuted by the dynamics of investors' appetite for risky investments. Therefore, despite the high probability of decline, traders should anticipate and set loss taking orders when opening positions according to money management rules, as well as align their open positions with the dynamics and technical picture of bonds and stock indices. Be aware and cautious!


