Hi, dear traders!
The World Health Organization does not rule out that the current phase of the pandemic could be the last, but the situation in the UK remains disconcerting. The peak of the current wave caused by the Omicron strain might have passed. However, it is unclear how long the tense COVID-19 situation would last.
The most important event on this week's economic calendar is the 2-day meeting of the Federal Reserve, followed by statements by Fed chairman Jerome Powell on Wednesday. Today's data releases are manufacturing and services PMI in both the UK and the US - they could influence the price dynamics of GBP/USD.
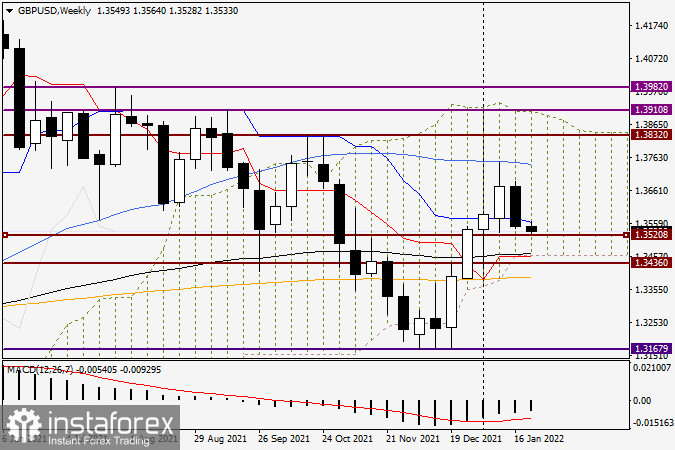
Weekly

Last week, GBP/USD tested the 50-day SMA line at 1.3751, but met heavy resistance and bounced downwards, creating a sizable upper shadow. As a result, the pair closed below the blue Kijun-Sen line of the Ichimoku cloud. Overall, the US dollar made gains against major currencies last week thanks to rising demand. The main goals for bearish traders are breaking through the support at 1.3520, the psychological level of 1.3500 and the lower border of the Ichimoku cloud at the strong technical level of 1.3465. The black 89-day EMA line and the red Tenkan-Sen line of the Ichimoku cloud also lie at 1.3465. If bullish reversal candlestick patterns appear near 1.3465 at lower timeframes, it would serve as a buy signal for GBP/USD.
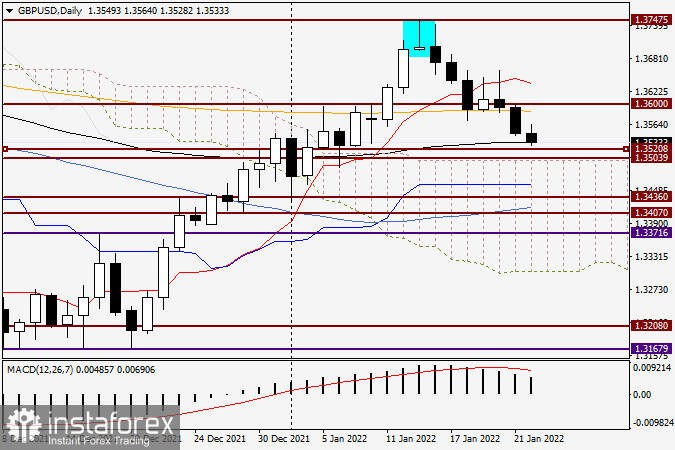
Daily

According to the daily chart, short positions could be opened if bearish reversal candlestick patterns appear in the 1.3588-1.3638 price range. In this area lies the strong 200-day EMA line, followed by the red Tenkan-Sen line above it. The strong technical level of 1.3600 could also reverse the pair downwards.
Good luck!


