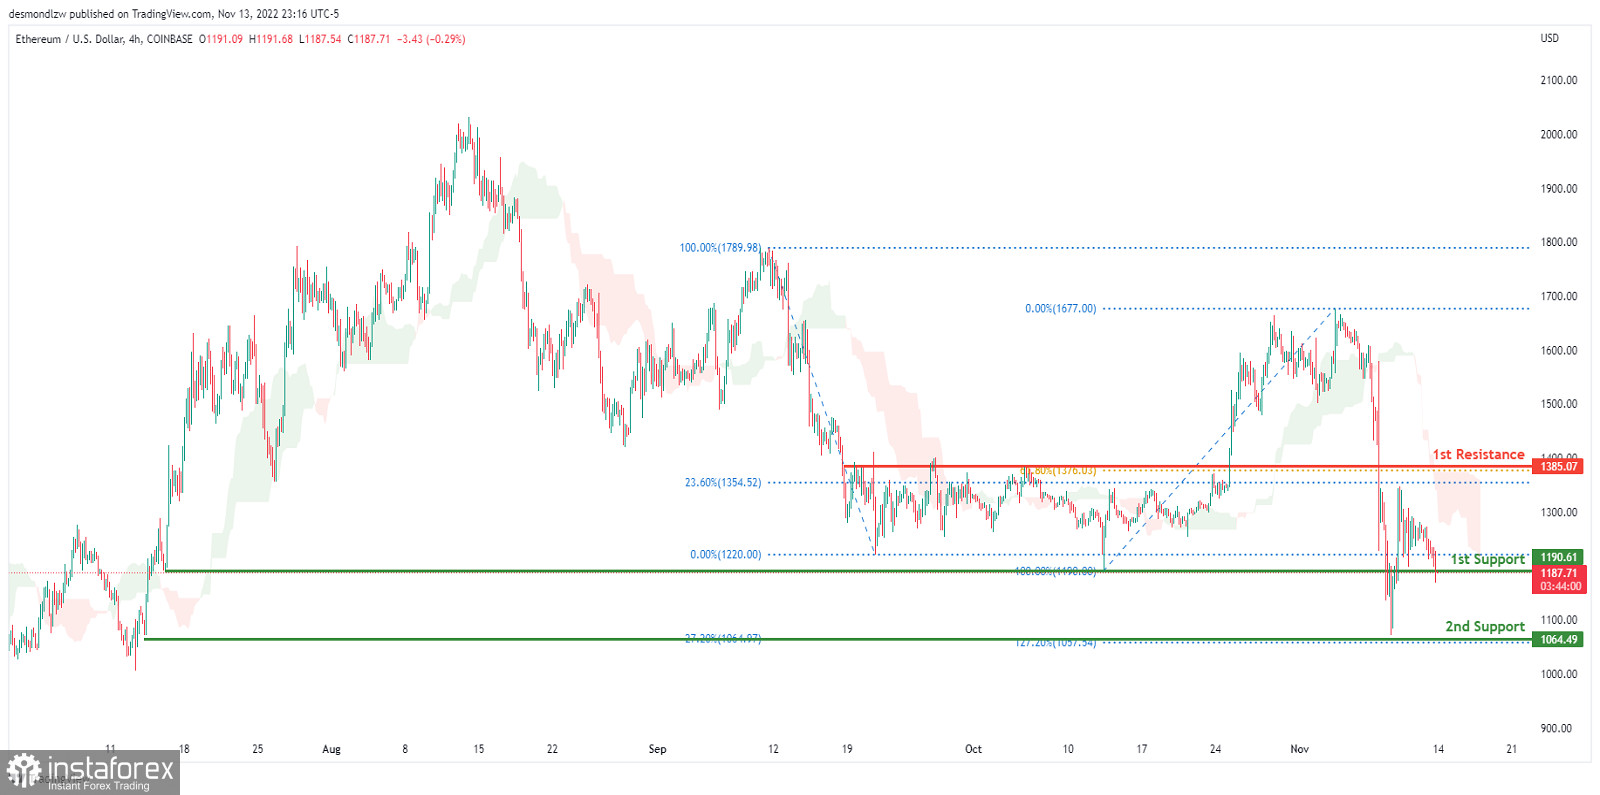
Looking at the H4 chart, the current overall bias for ETHUSD is bearish, with price currently under the Ichimoku cloud indicating a bearish market. If this bearish momentum continues, expect the price to break the 1st support line at 1190.61 where the previous low and 100% Fibonacci line was located and head towards the 2nd support at 1064.49 where the -27.2% Fibonacci expansion line and 127.2% Fibonacci extension line are located. In an alternative scenario, price could head back up to retest the 1st resistance line at 1385.07, where the 23.6% and 61.8% Fibonacci lines are located.
Trading Recommendation
Entry: 1385.07
Reason for Entry: 1st resistance line where the 23.6% and 61.8% Fibonacci lines are located.
Take Profit: 1190.61
Reason for Take Profit: 1st support line where the previous swing low and 100% Fibonacci line are located.
Stop Loss: 1677.00
Reason for Stop Loss:
Where the previous high was located


