


To open long positions on EUR/USD:
In my morning forecast, I outlined the level of 1.1292 as an entry point for opening positions. Now let us have a look at the 5-minute chart and describe the current situation. The lack of any macroeconomic events in the first half of the day sent the European currency under the level of 1.1292. After several false breakouts, a signal to buy the euro was formed at this level, but we also faced some losses there. Obviously, traders do not rush to open long positions on risk assets ahead of the Fed's meeting. No other signals have been generated.
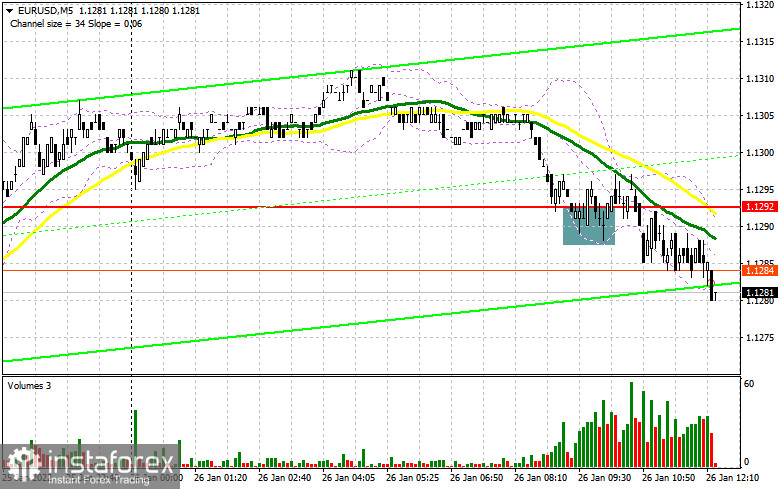
In the second half of the day, traders' focus will shift to US macroeconomic reports. However, they are unlikely to have any effect on the market compared to the event expected later in the day. Fed's decision on interest rates may significantly influence the forex market. In case the regulator displays a less aggressive stance, the pressure on risk assets will ease, creating a good signal for the euro's growth in the short term.
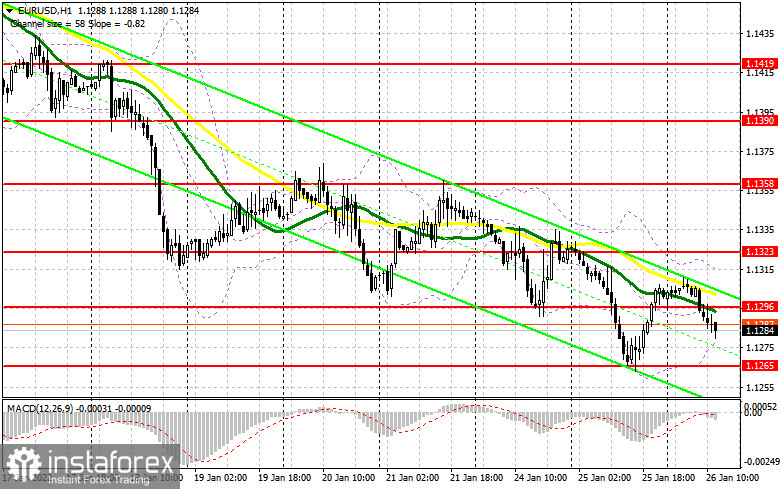
Now bulls have to do their best to regain control over the market. If the price fails to return to 1.1296 in the near term, the euro will continue to fall. In this case, the priority for buyers will be the support level of 1.1265. By reaching this level, the pair will confirm a persistent downtrend ahead of the US Federal Reserve monetary policy meeting. A false breakout at 1.1265 will generate a buy signal. However, an extended upward correction may take place only in case of disappointing data on the US trade balance and new home sales.
Another goal for buyers is to defend the level of 1.1296. A buy signal for EUR/USD may appear only if the Fed's policy remains unchanged and the price settles above this range. This will pave the way towards 1.1323. A further target is the high of 1.1358 where I recommend taking profit. If the pair declines during the New York session and bullish activity decreases near 1.1265, the euro may come under more pressure. If so, it is better to wait until the price reaches a new low of 1.1245. It is possible to open long positions at this level when a false breakout is formed. You can buy EUR/USD on a rebound from 1.1224 and 1.1208, keeping in mind a possible correction of 20-25 pips within the day.
To open short positions on EUR/USD:
Bears are still in control of the market. A confident return to the support level of 1.1296 will put more pressure on the pair. Low bullish activity below the 1.13 area confirms that market participants are cautious ahead of the FOMC's statement.
Today, sellers have managed to push the euro below 1.1296, supporting a further downtrend of the pair in the short term. As long as the pair is trading below this range, we can hope for a decline towards yesterday's low of 1.1265. A bottom-to-top breakout of this level along with strong economic reports in the US will create an additional signal for going short with the exit targets at 1.1245 and 1.1224. A further target is the area of 1.1208 where I recommend taking profit. However, the price may reach this level only in the case of a sudden sell-off in risk assets. The sell-off may be triggered by speculations around the Fed's monetary policy and rate hikes.
If the euro rises in the course of the North American session, bears will need to do their best to protect the resistance level of 1.1296. A false breakout of this level, above which moving averages are located, will create an additional entry point for opening short positions. I recommend selling EUR/USD right on a rebound from 1.1323 or 1.1358, keeping in mind a possible downward correction of 15-20 pips.
COT report
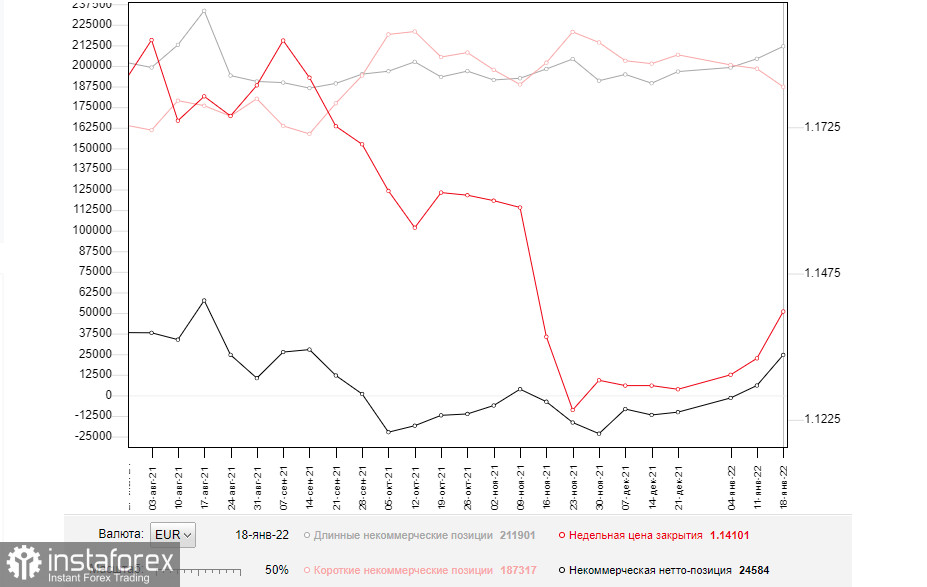
The COT (Commitment of Traders) report for January 18 revealed growth in the number of long positions and a decline in the short ones. As a result, the value of the positive delta became higher. This means that even despite anticipated changes in the Fed's policy, the euro remains in demand. Strong correction in EUR/USD means higher demand for the pair. This week, all eyes are on the meeting of the Federal Open Market Committee, which will announce its decision on monetary tightening. Some traders expect the Fed to raise interest rates as soon as January and not in March as was previously stated. In addition, the regulator will start to reduce its balance sheet. A lot will depend on Jerome Powell's rhetoric. If he expresses worries about inflation, the US dollar is likely to strengthen. At the moment, markets are discussing the possibility of four and even five rate hikes this year. In the meantime, the European Central Bank is planning to end its emergency bond buying program in March this year. However, the European regulator is not going to tighten its policy any further. This is the reason that limits the upside potential of risk assets. The COT report indicated that the number of long positions of the non-commercial group of traders increased from 204,361 to 211,901, while short positions of the same group dropped from 198,356 to 187,317. This proves that traders continue to add more long positions on the euro in hope of developing an uptrend. Last week, the total non-commercial net position remained in the positive zone at 24,584 versus 6,005. The closing price of the week increased to 1.1410 against 1.1330 a week earlier.
Indicator signals:
Moving Averages
If the pair is trading below the 30- and 50-day moving averages, this indicates a bear market.
Please note that the author analyzes the time period and prices of moving averages for the H1 chart only which differs from the general definition of the classic daily moving averages on the D1 chart.
Bollinger Bands
A breakout of the lower band at 1.1280 will put more pressure on the pair.
Description of indicators:
• A moving average determines the current trend by smoothing volatility and noise. 50-day period; marked in yellow on the chart;
• A moving average determines the current trend by smoothing volatility and noise. 30-day period; marked in green on the chart;
• Indicator MACD (Moving Average Convergence/Divergence) Fast EMA, 12-day period; Slow EMA, 26-day period. SMA with a 9-day period;
• Bollinger Bands: 20-day period;
• Non-commercial traders are speculators such as individual traders, hedge funds, and large institutions who use the futures market for speculative purposes and meet certain requirements;
• Long non-commercial positions represent the total number of long open position of non-commercial traders;
• Short non-commercial positions represent the total number of short open position of non-commercial traders;
• The total non-commercial net position is the difference between short and long positions of non-commercial traders.


