


Analyzing trades on Wednesday
EUR/USD on 30M chart
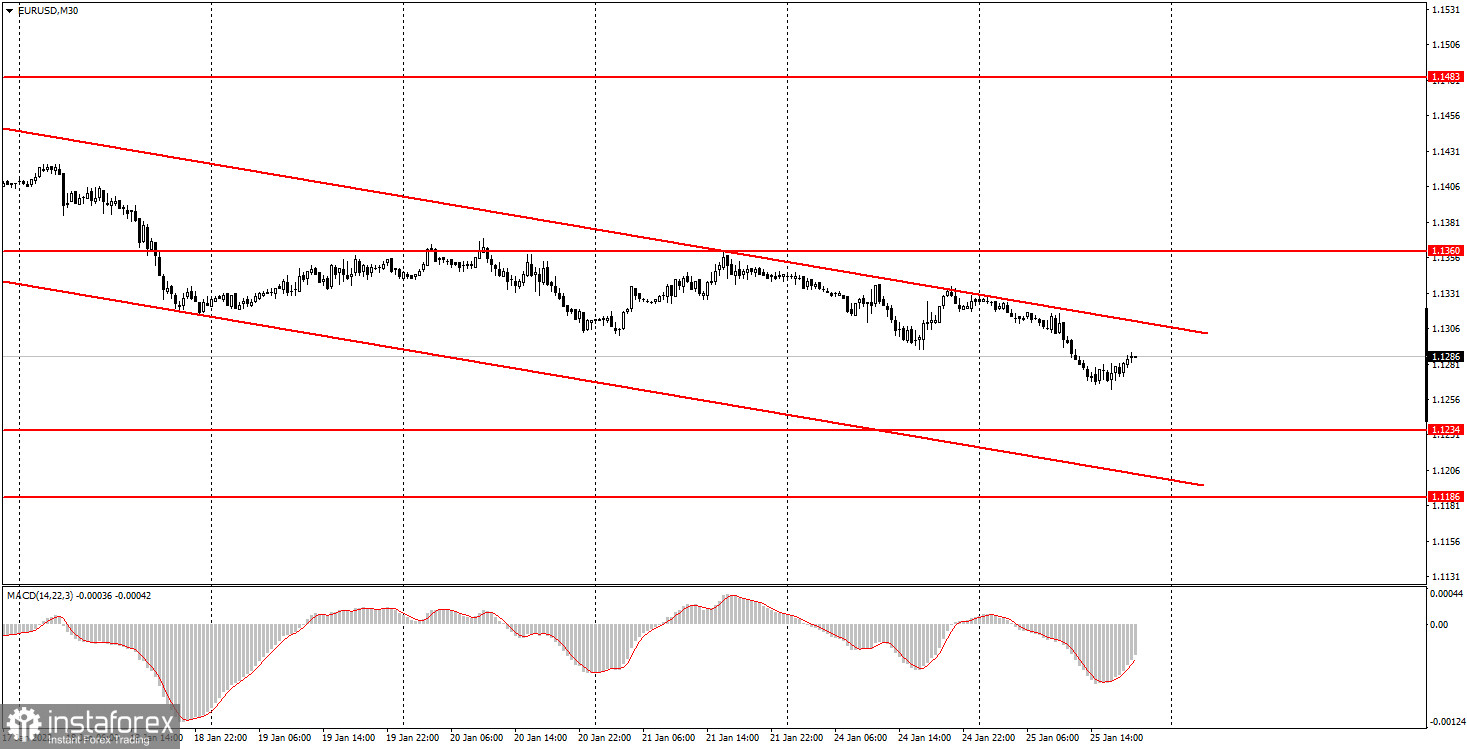
EUR/USD market activity was very low on Wednesday. In our previous review, we reminded you that the results of the FOMC meeting would be announced on Wednesday evening. This is one of the most important events for the foreign exchange market and the US dollar. As we can see, market participants preferred to wait for the outcome of the meeting, so trading activity was very low during the day. There was a minor downtrend on the intraday chart with volatility of just 40 pips. It is difficult to earn much with such low volatility, so this trend is not worth mentioning. In addition, the price made two attempts to leave the descending channel during the day, and each time it went above this range by just a few pips. Remarkably, there was neither a clear breakout of the channel nor a clear rebound from its upper boundary. Therefore, all technical signals formed during the day should have been ignored amid such a slow market.
EUR/USD on 5M chart
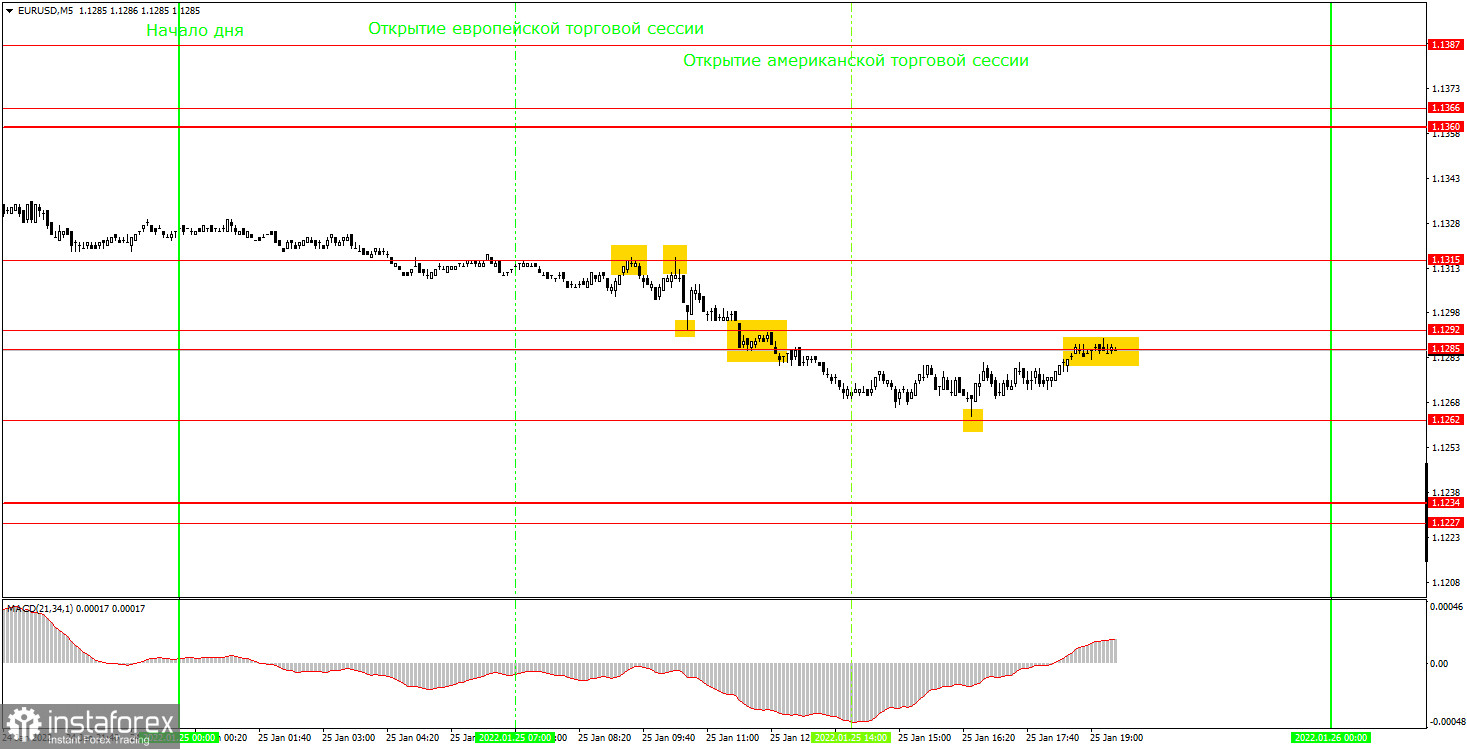
On the 5-minute time frame, we could observe a well-distinguished trend. Lately, the pair has been demonstrating at least a slight trend movement in the daily session, which usually results in a small profit. When there is no trend, there is no profit. Today, the pair had a chance to move lower on the daily chart which would go in line with the trend on the 30-minute time frame. However, after overcoming the area of 1.1285-1.1292, the price came to a halt. Then the pair rebounded from this area three more times. Obviously, it was not necessary to open short positions each time it made a pullback. Therefore, a sell order that was placed on the very first signal could be closed at any time during the day. This trade could bring you either a minimum loss or a minimum profit, which was quite difficult. Within an hour, the Fed will announce the results of its meeting, and the press conference with Jerome Powell will start. We do not recommend trading at this time, as it can be too dangerous. The market reaction can be unpredictable, with rapid fluctuations and mixed movements.
Trading tips on Thursday
On the 30-minute time frame, the price remains inside the sideways channel of 1.1234 - 1.1360 which is located within the descending channel. However, everything can change on Thursday morning. The levels marked on the chart can be used for trading, but both channels may be canceled after the Fed makes an announcement. On the 5-minute chart on Thursday, we recommend trading at these levels: 1.1227-1.1234, 1.1262, 1.1285-1.1292, 1.1315, and 1.1360-1.1366. In general, there are quite a lot of levels on the chart now, which is typical of a flat movement. Therefore, you need to be more careful when the price rebounds from these levels on the intraday chart. The macroeconomic background on Thursday will be moderate. Novice traders can pay attention to the US GDP report for the fourth quarter. There will be a few more minor reports, but they are unlikely to cause any market reaction. Besides, tomorrow, traders will be digesting the result of the FOMC meeting.
Basic rules of the trading system
1) The strength of the signal is determined by the time it took the signal to form (a rebound or a breakout of the level). The quicker it is formed, the stronger the signal is.
2) If two or more positions were opened near a certain level based on a false signal (which did not trigger a Take Profit or test the nearest target level), then all subsequent signals at this level should be ignored.
3) When trading flat, a pair can form multiple false signals or not form them at all. In any case, it is better to stop trading at the first sign of a flat movement.
4) Trades should be opened in the period between the start of the European session and the middle of the US trading hours when all positions must be closed manually.
5) You can trade using signals from the MACD indicator on the 30-minute time frame only amid strong volatility and a clear trend that should be confirmed by a trendline or a trend channel.
6) If two levels are located too close to each other (from 5 to 15 pips), they should be considered support and resistance levels.
On the chart
Support and Resistance Levels are the levels that serve as targets when buying or selling the pair. You can place Take Profit near these levels.
Red lines are channels or trend lines that display the current trend and show in which direction it is better to trade now.
The MACD indicator (14, 22, and 3) consists of a histogram and a signal line. When they cross, this is a signal to enter the market. It is recommended to use this indicator in combination with trend patterns (channels and trendlines).
Important announcements and economic reports that can be found on the economic calendar can seriously influence the trajectory of a currency pair. Therefore, at the time of their release, we recommend trading as carefully as possible or exiting the market in order to avoid sharp price fluctuations.
Beginners on Forex should remember that not every single trade has to be profitable. The development of a clear strategy and money management is the key to success in trading over a long period of time.


