


The price of Bitcoin continues to move sideways in the short term. After its strong drop, a rebound was natural. The rate retested the broken levels and now it could extend its downside movement.
BTC/USD is down by 1.26% in the last 24 hours and by 1.15% in the last 7 days. Technically, the crypto could extend its sideways movement as long as it's trapped within the current triangle.
BTC/USD Retested The Sellers!
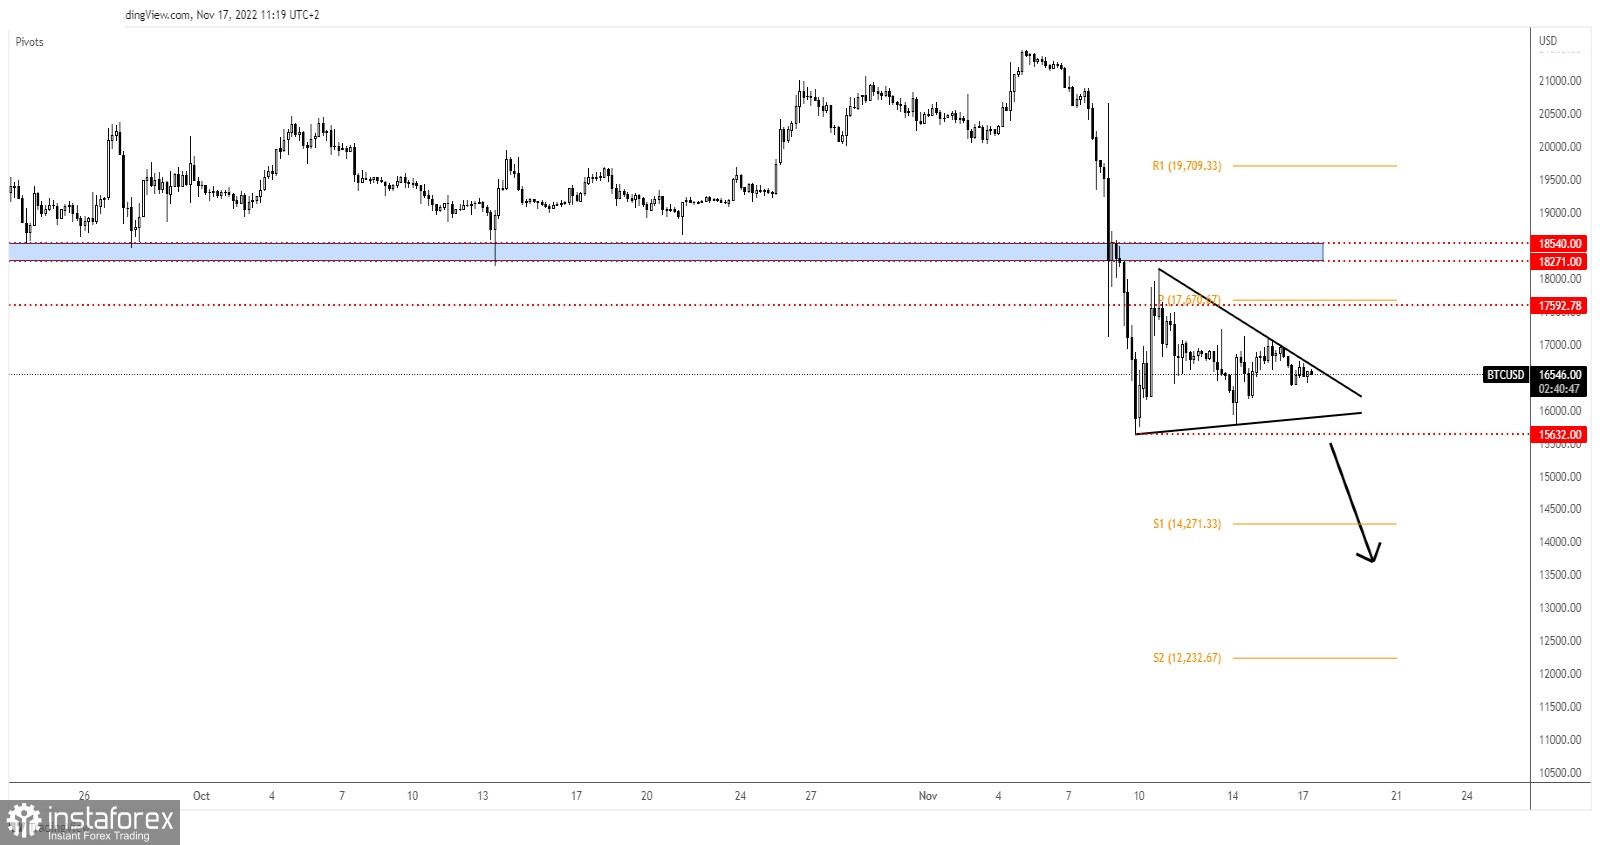
As you can see on the h4 chart failed to take out 17,592 signaling strong sellers. The bias remains bearish, so a further drop is in the cards. The sideways movement is seen as a downside continuation pattern.
From a technical point of view, the minor downtrend line represents a dynamic resistance, while 15,632 stands as a critical static support.
BTC/USD Forecast!
17,592, 18,271, and 18,540 are seen as strong resistance levels. So, a new lower low, a valid breakdown below the 15,632 low activates more declines.


