


Overview :
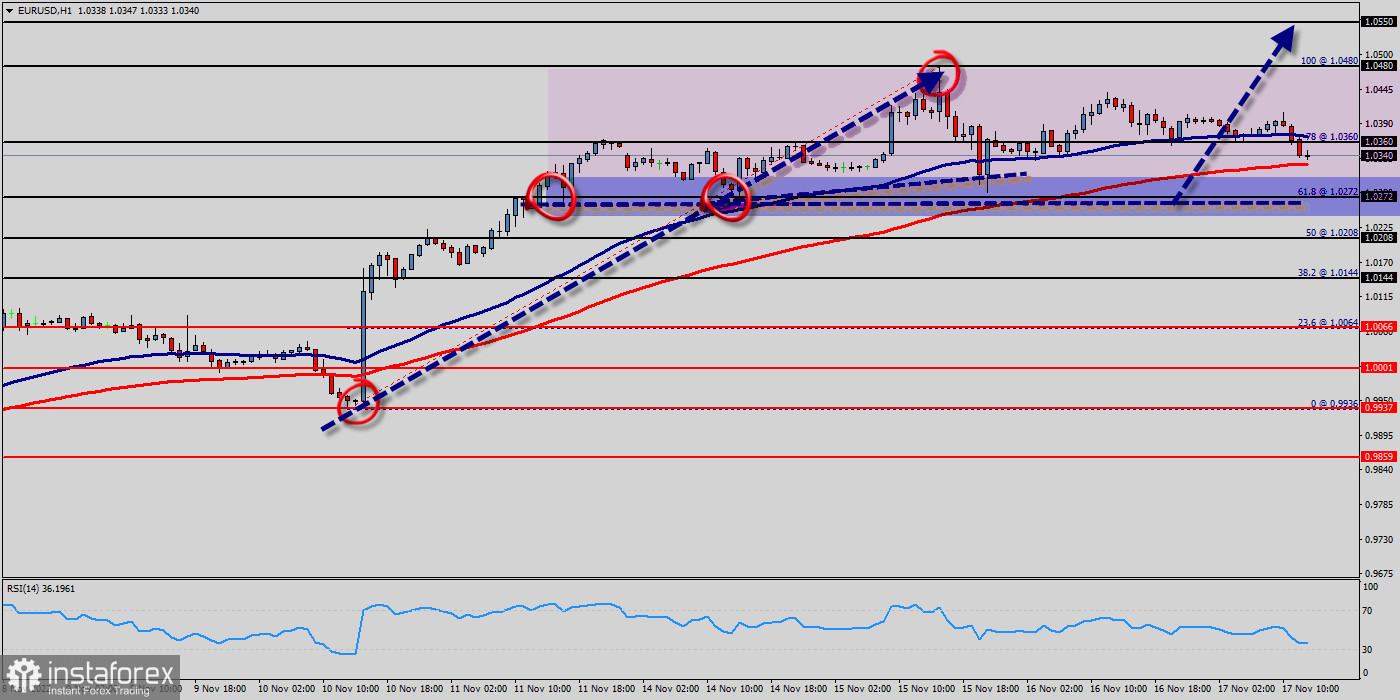
The EUR/USD pair's rise from 1.0272 is still in progress and intraday bias stays on the upside for 1.0272 resistance first on the one-hour chart. All elements being clearly bullish market, it would be possible for traders to trade only long positions on the EUR/USD pair as long as the price remains well above the price of 1.0272. The EUR/USD pair will continue rising from the level of 1.0272 in the long term. It should be noted that the support is established at the level of 1.0272 which represents the daily pivot point. The price is likely to form a double bottom in the same time frame. Accordingly, the EUR/USD pair is showing signs of strength following a breakout of the highest level of 1.0340. This suggests that the pair will probably go up in coming hours.
If the trend is able to break the level of 1.0340, then the market will call for a strong bullish market towards the objectives between 1.0272 ans 1.0480 this week. Currently, the price is in a bullish channel. This is confirmed by the RSI indicator signaling that we are still in a bullish trending market. As the price is still above the moving average (100), immediate support is seen at 1.0272, which coincides with a key ratio (61.8% of Fibonacci). The EUR/USD pair swing around the breached resistance of the bullish channel and keeps its stability above it until now, noticing that the EMA50 continues to resistance the price from above, while RSI begins to overlap positively.
Thus, the market is indicating a bullish opportunity above the above-mentioned support levels, for that the bullish outlook remains the same as long as the 100 EMA is headed to the upside. So, buy above the level of 1.0340 with the first target at 1.0360 in order to test the daily resistance 1. The buyers' bullish objective is set at the level of 1.0480. A bullish break in this resistance would boost the bullish momentum. The buyers could then target the resistance located at 1.0480. If there is any crossing, the next objective would be the resistance located at 1.0480. The level of 1.0550 is a good place to take profits.
Moreover, the RSI is still signaling that the trend is upward as it remains strong above the moving average (100). However, beware of bullish excesses that could lead to a possible short-term correction; but this possible correction would not be tradeable.
On the other hand, in case a reversal takes place and the EUR/USD pair breaks through the support level of 1.0272, a further decline to 1.0208 and 1.0144 can occur. It would indicate a bearish market.


