


Trend analysis (Fig. 1).
The market may move up on Wednesday from the level of 1.3520 (close of yesterday's daily candle) to the target level of 1.3552, the 50.0% retracement level (blue dotted line). In case of testing this level, the price may move downwards to the target level of 1.3526, the 38.2% retracement level (red dotted line). On the news at 13:15 UTC, the price may resume its upward movement.
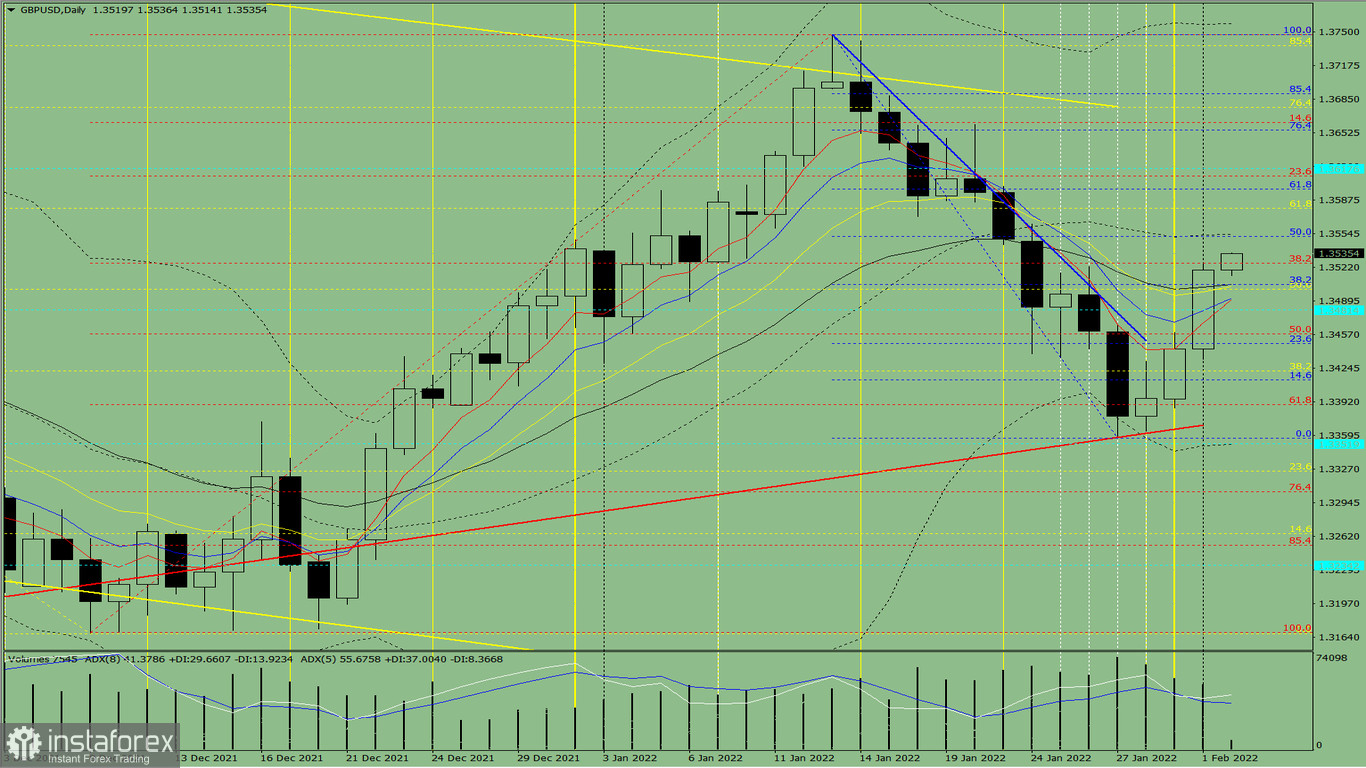
Fig. 1 (daily chart).
Comprehensive analysis:
- Indicator analysis - down;
- Fibonacci levels - down;
- Volumes - down;
- Candlestick analysis - down;
- Trend analysis - up;
- Weekly chart - up;
- Bollinger Bands – up.
General conclusion:
The price may move up today from the level of 1.3520 (close of yesterday's daily candle) to the target level of 1.3552, the 50.0% retracement level (blue dotted line). In case of testing this level, the price may move downwards to the target level of 1.3526, the 38.2% retracement level (red dotted line). On the news at 13:15 UTC, the price may resume its upward movement.
Unlikely scenario: from the level of 1.3520 (close of yesterday's daily candle), the price may start moving down to the target level of 1.3458, the 50% retracement level (red dotted line). In case of testing this level, the price may start moving upwards.


