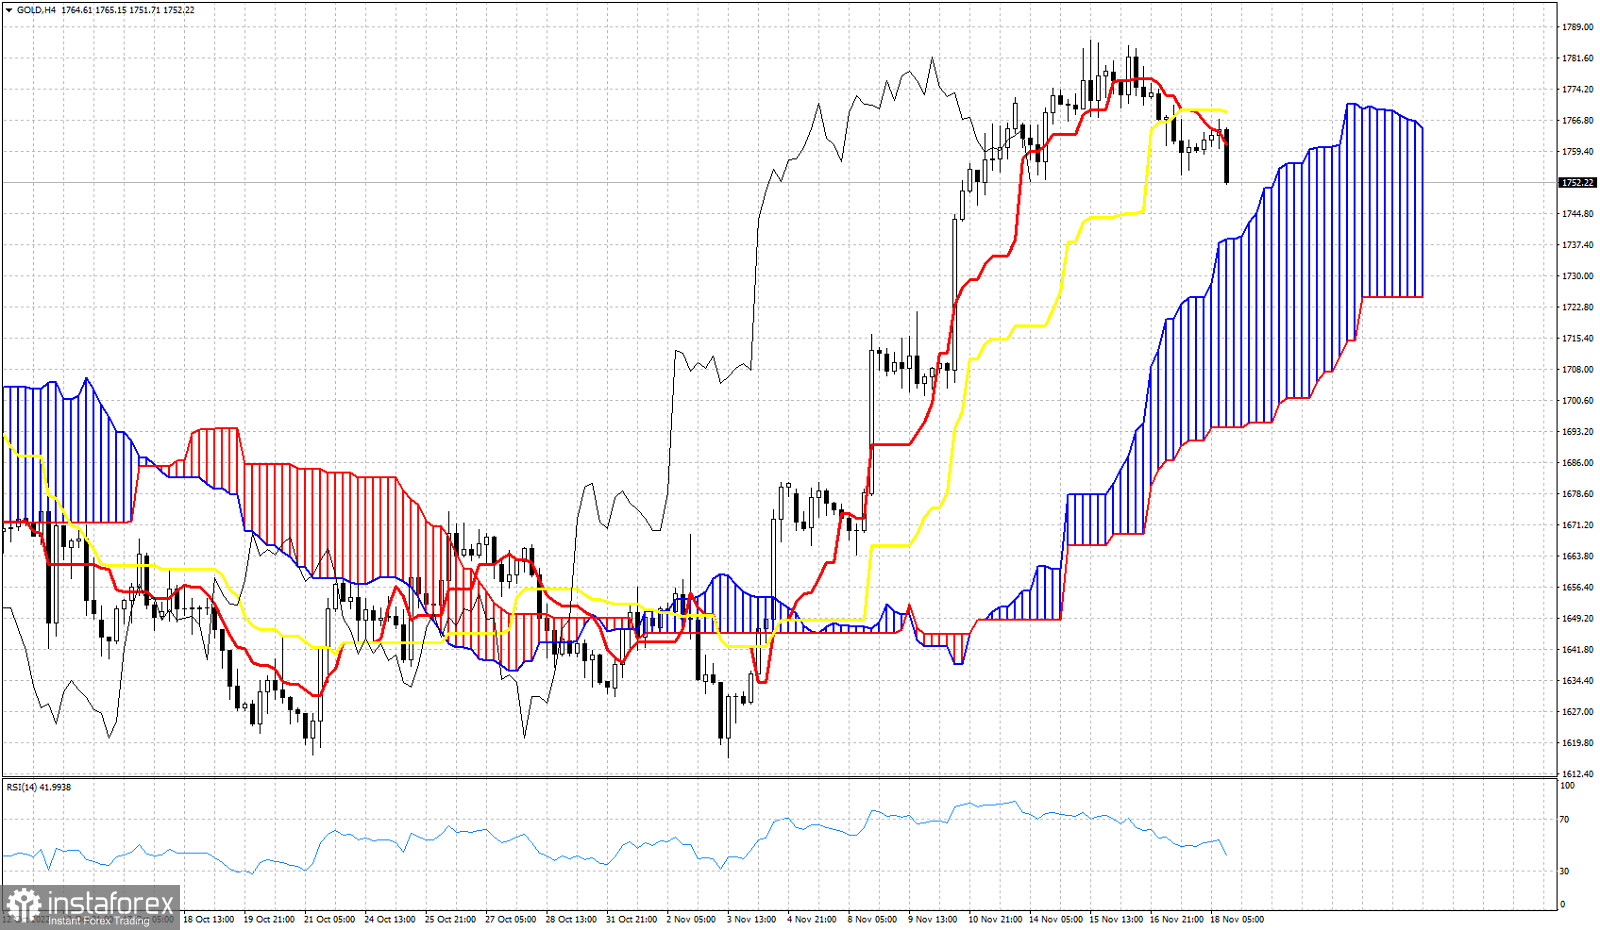
As we explained in our previous analysis on Gold, the precious metal is vulnerable to a pull back towards $1,720. Using the Ichimoku cloud indicator we identify key support and resistance levels and how deep this pull back can be. As one can see in the 4 hour chart above using the Icimoku cloud indicator, trend remains bullish but price is vulnerable to a pull back. The Tenkan-sen (red line indicator) has crossed below the kijun-sen (yellow line indicator). This is a sign of weakness. The Chikou span (black line indicator) is also challenging the candlestick pattern and if it breaks below it, we could get another bearish signal. Price is vulnerable to a move towards the Kumo (cloud) at $1,740 as long as price is below the kijun-sen. The kijun-sen is at $1,768 and is the most important short-term resistance level. As long as price is below this level, Gold price will be vulnerable to the downside.


