


Trend analysis (Fig. 1).
The market may move up on Friday from the level of 1.3595 (close of yesterday's daily candle) to the target level of 1.3656, the resistance line (yellow bold line). After testing this level, the price may start to move downward to the target level of 1.3618, the historical support level (blue dotted line).
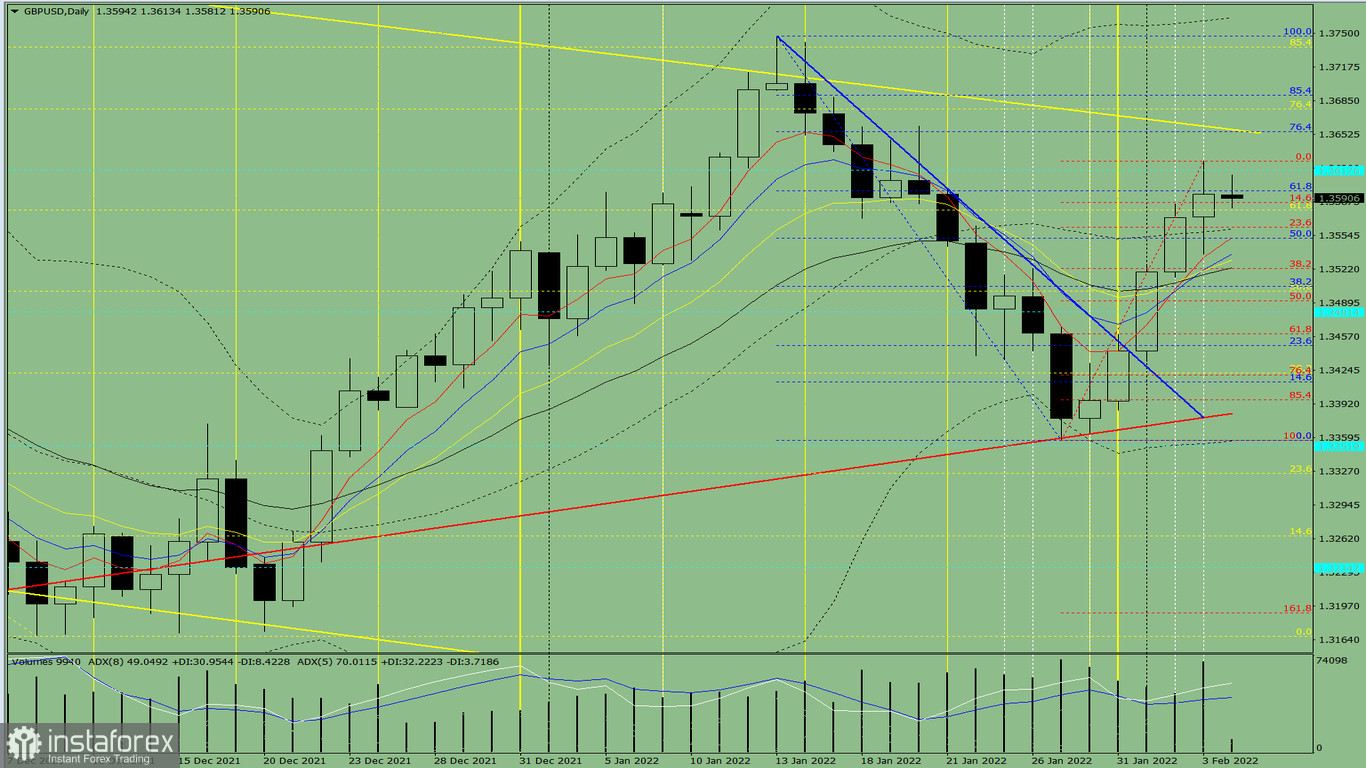
Fig. 1 (daily chart)
Comprehensive analysis:
- Indicator analysis - up;
- Fibonacci levels - up;
- Volumes - up;
- Candlestick analysis - up;
- Trend analysis - up;
- Bollinger bands - up;
- Weekly chart - up.
General conclusion :
The price may move up today from the level of 1.3595 (close of yesterday's daily candle) to the target level of 1.3656, the resistance line (yellow bold line). After testing this level, the price may start to move downward to the target level of 1.3618, the historical support level (blue dotted line).
Unlikely scenario: from the level of 1.3595 (close of yesterday's daily candle), the price may start moving down to the target level of 1.3563, the 23.6% retracement level (red dotted line). After testing this level, the price may move upward to the target level of 1.3656, the resistance line (yellow bold line).


