


Analysis of Monday's trades:
30M chart of EUR/USD
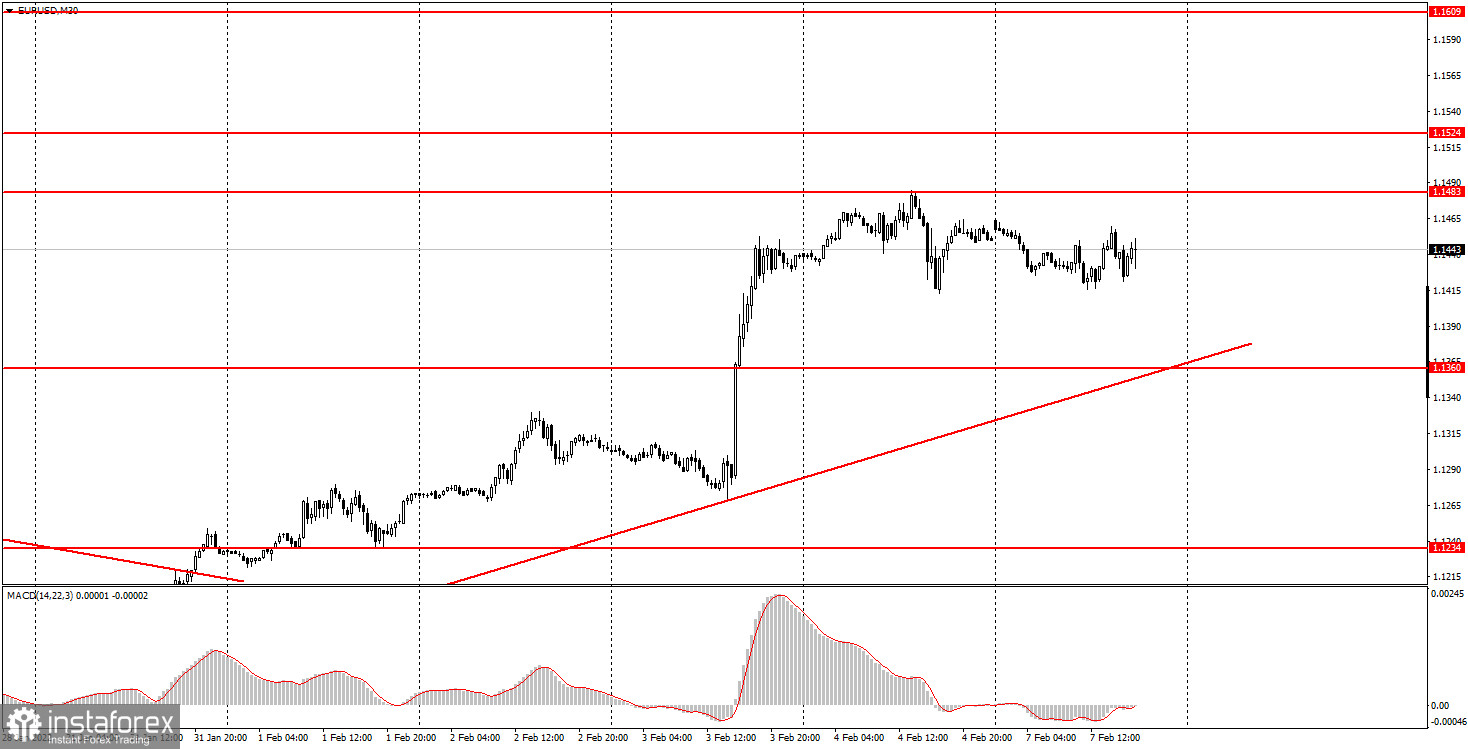
The euro/dollar pair moved sideways on Monday due to the empty macroeconomic calendar both in the United States and the eurozone. So, the corrective move that started last Friday continued. At the same time, this correction is a weak one. Therefore, the pair failed to reach the Friday low. Generally speaking, the price only moved sideways on Monday. In addition, volatility was rather low. The unwillingness of traders to sell the instrument or lock in profits on long positions looks rather strange given that there are no important fundamentals that could drive the pair up at the moment. Nevertheless, the ascending trendline maintains the current uptrend. Therefore, long positions should be considered before the price consolidates below it. So, the pair showed a sluggish movement on Monday.
M5 chart of EUR/USD
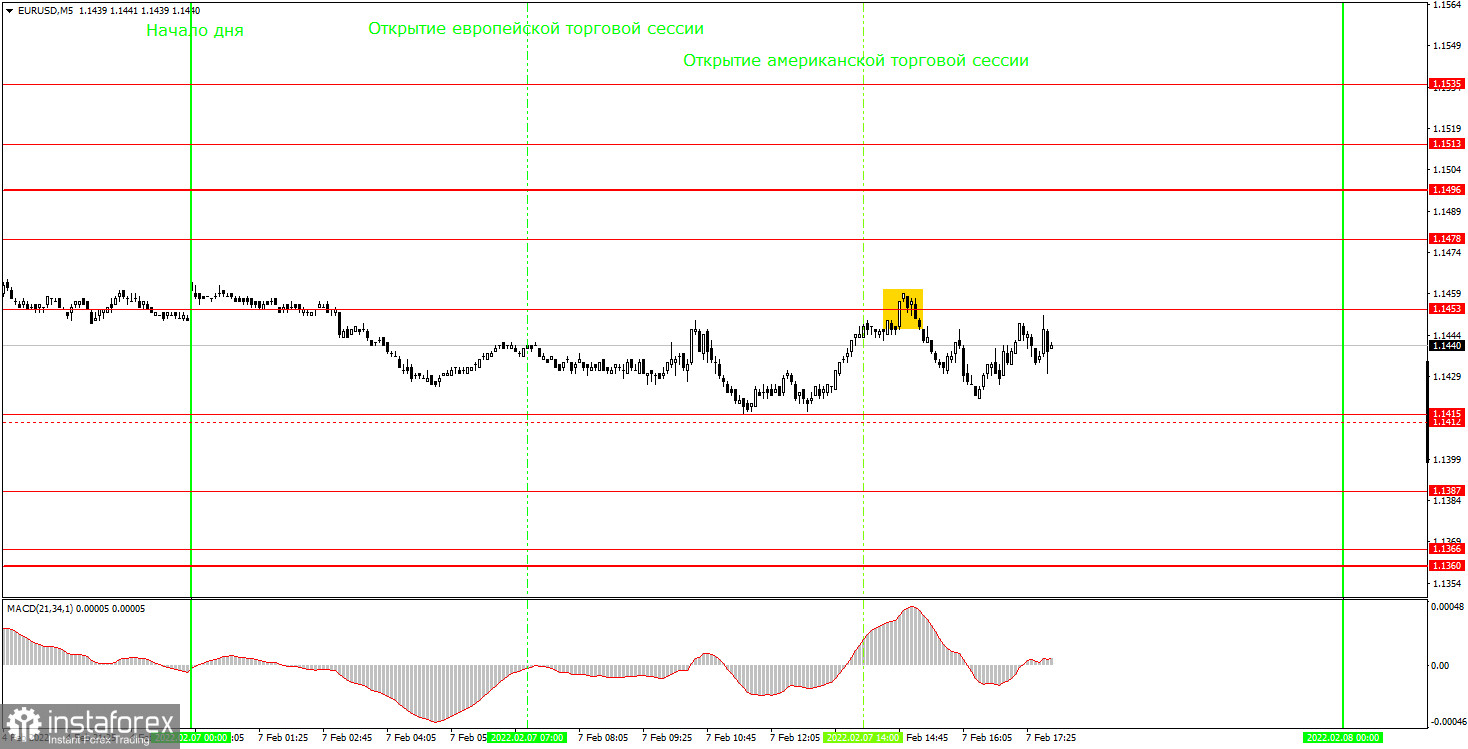
In the M5 time frame, the price was flat, which is confirmed by the chart. The pair traded in the range between 1.1412 and 1.1453 all day. Volatility was 47 pips. Many false signals are usually produced during the flat movement. However, beginner traders were lucky on Monday as just one false signal was generated. At the opening of the North American session, the price bounced from the level of 1.1453 and went down by 25 pips. The quote failed to reach the lower limit of the sideways channel - 1.1412. Therefore, the only way to receive a profit was to close short trades manually. At the same time, not to incur losses, a stop-loss order was set at the breakeven point after the price had gone down by 15 pips. Tuesday is going to be another uneventful day in the market due to the again empty macroeconomic calendar and the absence of important fundamentals.
Trading plan for Tuesday:
In the 30M time frame, the uptrend continues. This trading week, the pair may head towards the descending trendline. However, due to the lack of important fundamentals and the empty macroeconomic calendar, the pair is likely to be flat in the first three trading days. A rebound from the trendline could trigger the uptrend. At the same time, the pair may simply ignore the trendline and cross it when moving sideways, which could not be considered a signal to sell. The target levels in the 5M time frame are seen at 1.1387, 1.1415, 1.1453, 1.1478, 1.1496, 1.1513, and 1.1535. A stop-loss order should be set at the breakeven point after the price moves up by 15 pips. Tuesday's macroeconomic calendar will be empty both in the United States and the eurozone. Therefore, the day is likely to be uneventful, volatility to remain at a low level, and the sideways movement ot continue. At the same time, the corrective move that started last Friday may extend.
Basic principles of the trading system:
1) The strength of the signal depends on the time period during which the signal was formed (a rebound or a break). The shorter this period, the stronger the signal.
2) If two or more trades were opened at some level following false signals, i.e. those signals that did not lead the price to Take Profit level or the nearest target levels, then any consequent signals near this level should be ignored.
3) During the flat trend, any currency pair may form a lot of false signals or do not produce any signals at all. In any case, the flat trend is not the best condition for trading.
4) Trades are opened in the time period between the beginning of the European session and until the middle of the American one when all deals should be closed manually.
5) We can pay attention to the MACD signals in the 30M time frame only if there is good volatility and a definite trend confirmed by a trend line or a trend channel.
6) If two key levels are too close to each other (about 5-15 pips), then this is a support or resistance area.
How to interpret charts:
Support and resistance price levels can serve as targets when buying or selling. You can place Take Profit near them.
Red lines are channels or trend lines that display the current trend and show which direction is better to trade.
MACD indicator (14,22,3) is a histogram and a signal line showing when it is better to enter the market when they cross. This indicator is better to be used in combination with trend channels or trend lines.
Important speeches and reports that are always reflected in the economic calendars can greatly influence the movement of a currency pair. Therefore, during such events, it is recommended to trade as carefully as possible or exit the market in order to avoid a sharp price reversal against the previous movement.
Beginner traders should remember that every trade cannot be profitable. The development of a reliable strategy and money management is the key to success in long-term trading.


