


Analysis of previous deals:
30M chart of the GBP/USD pair
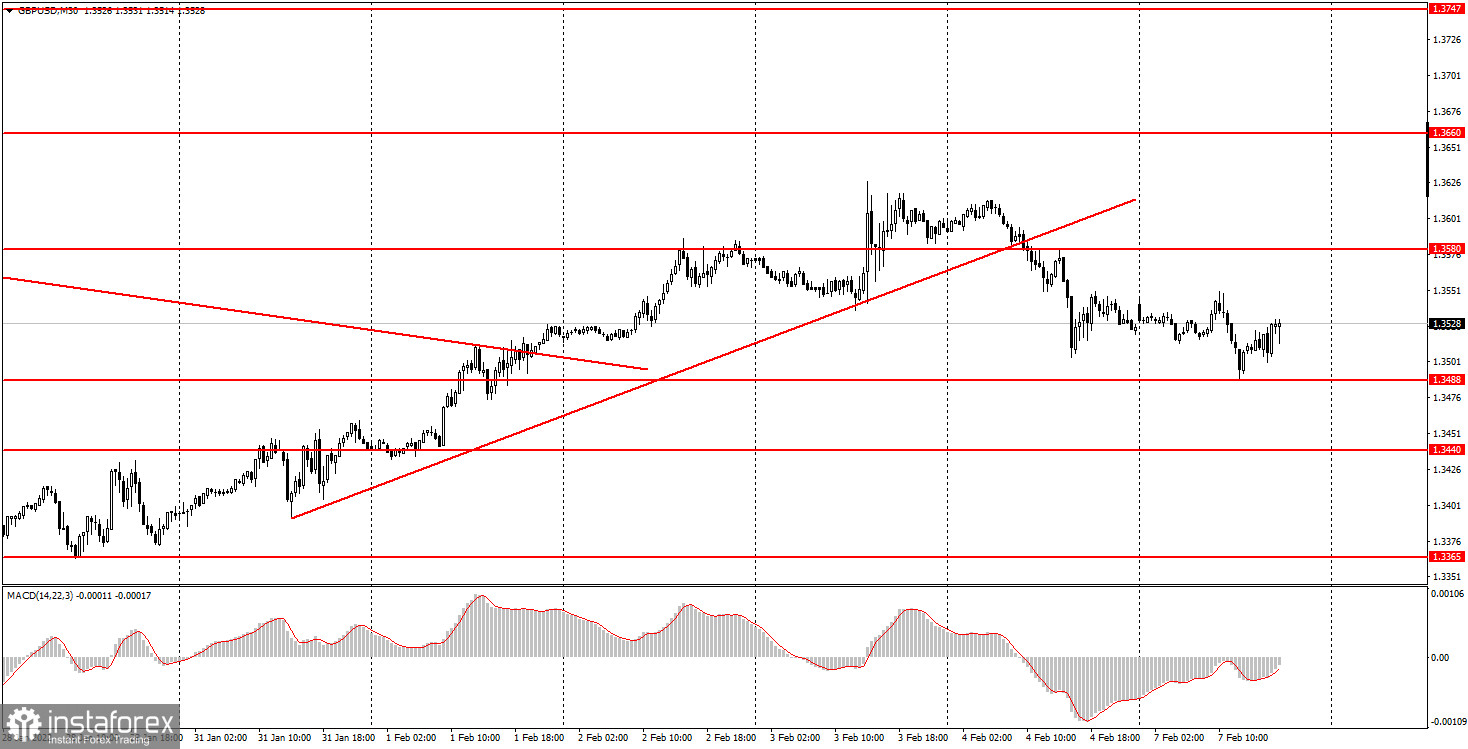
The GBP/USD pair also continued to adjust on Monday, but unlike the EUR/USD pair, it managed to continue its downward movement, although it was not very strong. Thus, the pair managed to fall to the level of 1.3488 during the day and work it out perfectly. So far, it is unclear whether the correction will end here and the upward trend will resume, or whether the downward movement will continue and the downward trend will resume? Recall that the fundamental background is not the most unambiguous now, since the Federal Reserve and the Bank of England have embarked on the path of tightening monetary policy, so both the pound and the dollar have support. However, the situation with the pound is now confusing on many timeframes, even on higher ones. Therefore, for some time you should trade in a neutral atmosphere, without thinking about the direction of the global trend. That is, to trade as locally and short-term as possible. No important reports in the UK and the US on Monday, and there was nothing else interesting. Therefore, the volatility equal to 60 points is easily explained.
5M chart of the GBP/USD pair
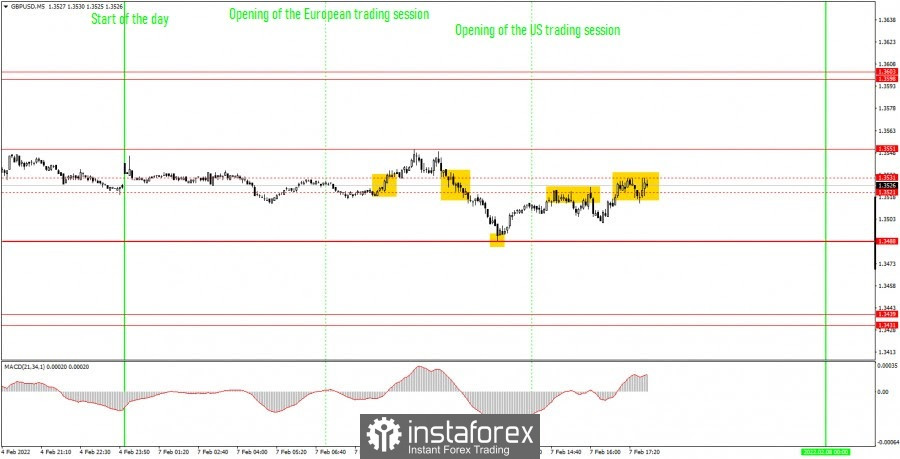
On the 5-minute timeframe on Monday, the pound/dollar pair faced the problem that the euro/dollar pair managed to avoid. There was also a flat during the day, but there were two levels exactly in the middle of the horizontal channel, which the price crossed throughout the day. As a result of Monday, we decided to remove these levels from the chart. However, not everything is as bad as it may seem at first glance. Let's analyze all the trading signals. At first, the price settled above the 1.3521-1.3531 area, which was a buy signal. However, the price managed to go up only 11 points, so it was hardly possible to make money on this deal. Then the price settled below the above-mentioned area and went down 24 points, just perfectly reaching the level of 1.3488. According to this transaction, novice traders should have already made a profit and immediately opened a long position, as a buy signal was formed. The price rose again to the area of 1.3521-1.3531 and rebounded from it, so the long position should be closed. The profit turned out to be small. According to the same rebound, new short positions should have been opened, but this time the deal turned out to be false and did not bring profit. As a result, we have two profitable and two unprofitable trades. In general, newcomers could end the day with zero or minimal profit, which is absolutely normal for a flat day.
How to trade on Tuesday:
The upward trend is reversed on the 30-minute TF. Therefore, from a technical point of view, now the pair can continue to fall. At least for a while. However, an unsuccessful attempt to overcome the level of 1.3488 may mean the end of the downward march. On the 5-minute TF tomorrow, it is recommended to trade by levels 1.3431-1.3439, 1.3488, 1.3551, 1.3598-1.3603. When the price passes after opening a deal in the right direction, 20 points should be set to Stop Loss at breakeven. There won't be a single important macroeconomic report or a single important fundamental event in the UK and America tomorrow. Therefore, traders will again have nothing to react to during the day. Therefore, you will have to trade exclusively by levels. The flat may persist, so novice traders may not enter the market on Tuesday, if the nature of the pair's movement is already clear in the morning.
Basic rules of the trading system:
1) The signal strength is calculated by the time it took to form the signal (bounce or overcome the level). The less time it took, the stronger the signal.
2) If two or more deals were opened near a certain level based on false signals (which did not trigger Take Profit or the nearest target level), then all subsequent signals from this level should be ignored.
3) In a flat, any pair can form a lot of false signals or not form them at all. But in any case, at the first signs of a flat, it is better to stop trading.
4) Trade deals are opened in the time period between the beginning of the European session and until the middle of the American one, when all deals must be closed manually.
5) On the 30-minute TF, using signals from the MACD indicator, you can trade only if there is good volatility and a trend, which is confirmed by a trend line or a trend channel.
6) If two levels are located too close to each other (from 5 to 15 points), then they should be considered as an area of support or resistance.
On the chart:
Support and Resistance Levels are the Levels that serve as targets when buying or selling the pair. You can place Take Profit near these levels.
Red lines are the channels or trend lines that display the current trend and show in which direction it is better to trade now.
The MACD indicator (14,22,3) consists of a histogram and a signal line. When they cross, this is a signal to enter the market. It is recommended to use this indicator in combination with trend lines (channels and trend lines).
Important speeches and reports (always contained in the news calendar) can greatly influence the movement of a currency pair. Therefore, during their exit, it is recommended to trade as carefully as possible or exit the market in order to avoid a sharp price reversal against the previous movement.
Beginners on Forex should remember that not every single trade has to be profitable. The development of a clear strategy and money management are the key to success in trading over a long period of time.


