Technical Market Outlook:
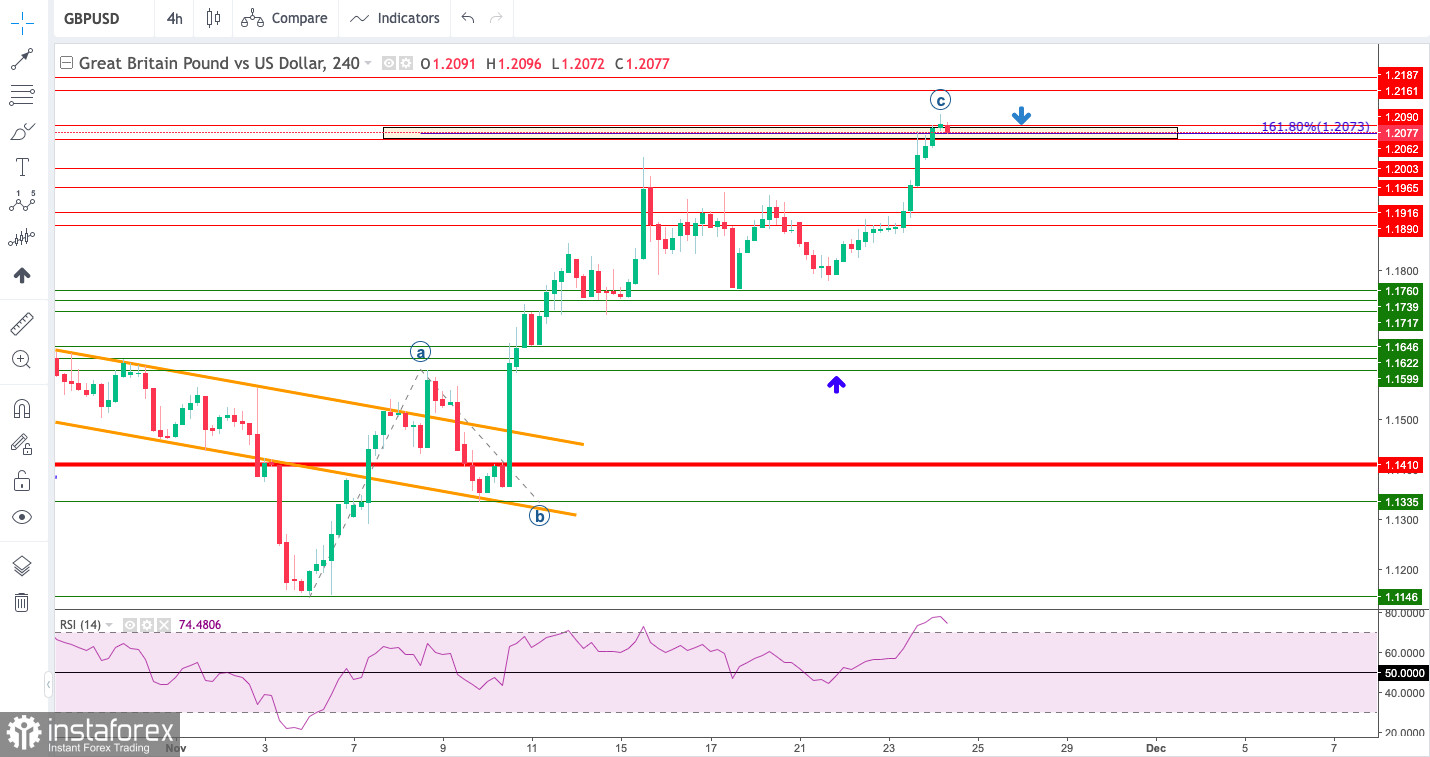
The GBP/USD pair has hit the target for bulls located at 161% Fibonacci extension level at 1.2073. This might be a perfect target for wave C as well, so please pay attention to the bears response. The market has done a Pin Bar candlestick at the top of the rally at the H4 time frame chart already. The intraday technical support is seen at 1.2003, 1.1965 and 1.1916 and only a clear and sustained breakout below this zone might confirm the sooner than expected termination of the wave C. The strong and positive momentum supports the short term bullish outlook for GBP on the H4 time frame chart, however the market conditions are extremely overbought.

Weekly Pivot Points:
WR3 - 1.19775
WR2 - 1.19122
WR1 - 1.18732
Weekly Pivot - 1.18469
WS1 - 1.18079
WS2 - 1.17816
WS3 - 1.17163
Trading Outlook:
The bulls are temporary in control of the market and the 38% Fibonacci retracement of the last wave down located at 1.1830 had been tested already as the bulls keep trying to gain move upside ground. On the other hand, the level of 1.0351 has not been tested since 1985, so the down trend is strong. In order to terminate the down trend, bulls need to break above the level of 1.2275 (swing high from August 10th).


