


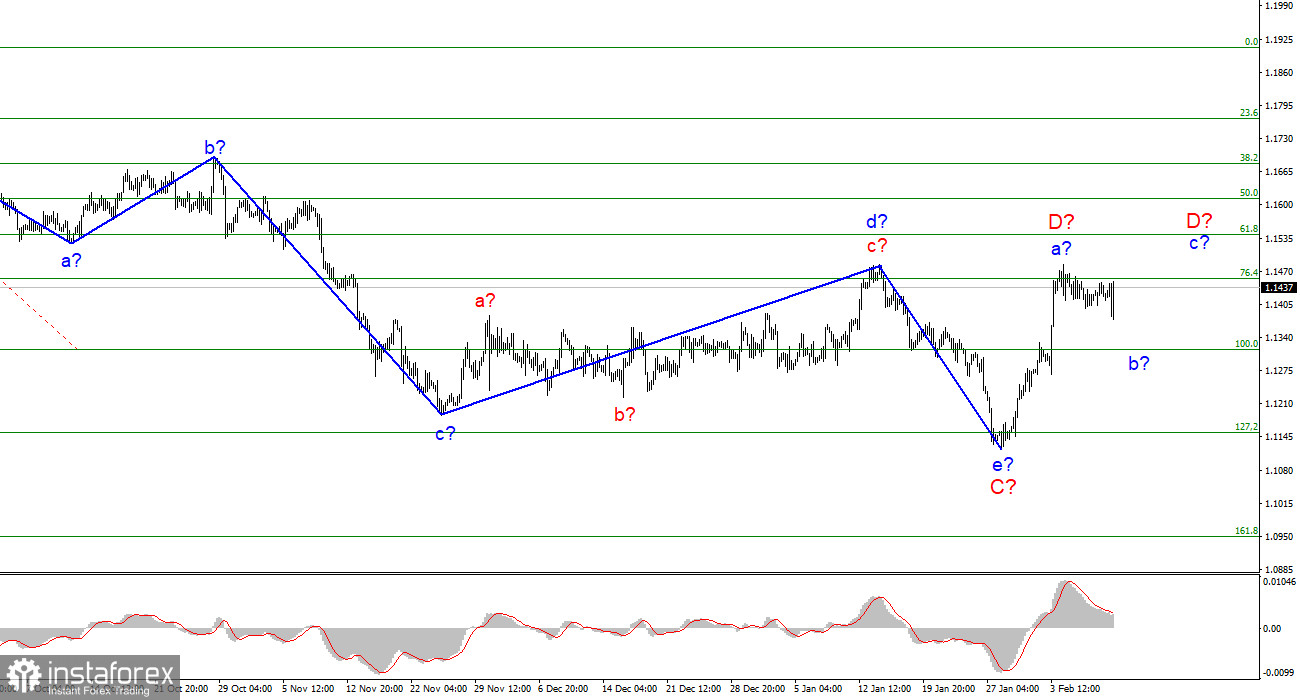
The wave pattern of the 4-hour chart for the Euro/Dollar instrument has undergone certain changes, but nothing drastic. Last week, there was a strong increase in quotes, thus, wave e in C was recognized as completed, since it turned out to be about the same size as the previous wave d in C. Therefore, the current upward wave is either D or 1.
An attempt to break through the 1.1455 mark, which corresponds to 76.4% Fibonacci level, may become the third in recent weeks and again lead to the exit of quotes from the reached highs, as well as to the completion of the current wave. But the decline of the instrument this week can be interpreted as a wave b in D.
Thus, the wave pattern now still indicates a decline in quotes. Now wave c in D can be constructed, within which the instrument can rise above the 15th figure. However, a further increase in quotes may require adjustments to the current wave markup, since wave D will take on too large a form.
The market waited
The Euro/Dollar instrument rose by 40 basis points on Thursday, demonstrating an amplitude equal to 50 points. This happened due to the fact that after the release of the inflation report, the market at first significantly increased the demand for the U.S. currency, but the happiness for the dollar did not last long. An hour after the report, buyers entered the market and the instrument began a strong increase by 100 basis points. Thus, at the end of the day, the instrument grew, and the market reaction to the inflation report turned out to be absolutely ambiguous. The indicator itself also increased, from 7.0% YoY to 7.5% YoY.
The initial growth of the U.S. dollar, from my point of view, was absolutely natural. The higher the inflation, the higher the probability of the Fed raising the key rate more than 4 times this year. However, how do we explain the subsequent decline in the U.S. currency? I believe that the wave pattern played a role here. There were no other reasons for the growth of the instrument. It seems that the market has tuned in either to a three-wave structure in D, or it will still try to build the first wave of a new upward trend segment.
Also, I would like to note that the European Commission's report on the state of the economy was released today. According to this report, forecasts for EU GDP have been lowered to 4%, and forecasts for inflation have increased to 3.9%. Thus, there was no reason for the market to increase demand for the euro today. And the increase in the instrument can only be explained by wave marking.
Overall conclusions
Based on the analysis, I conclude that the construction of the downward wave C is completed. However, wave D can already be completed too. If so, now is a good time to sell the European currency. At least with a target located near the 1.1314 mark. Another upward wave can be built inside wave D. And if the current wave is recognized not as D, but as 1 as part of a new upward trend segment, then in the near future we will not receive a downward signal from the MACD indicator. Thus, now there are cautious sales based on MACD signals.
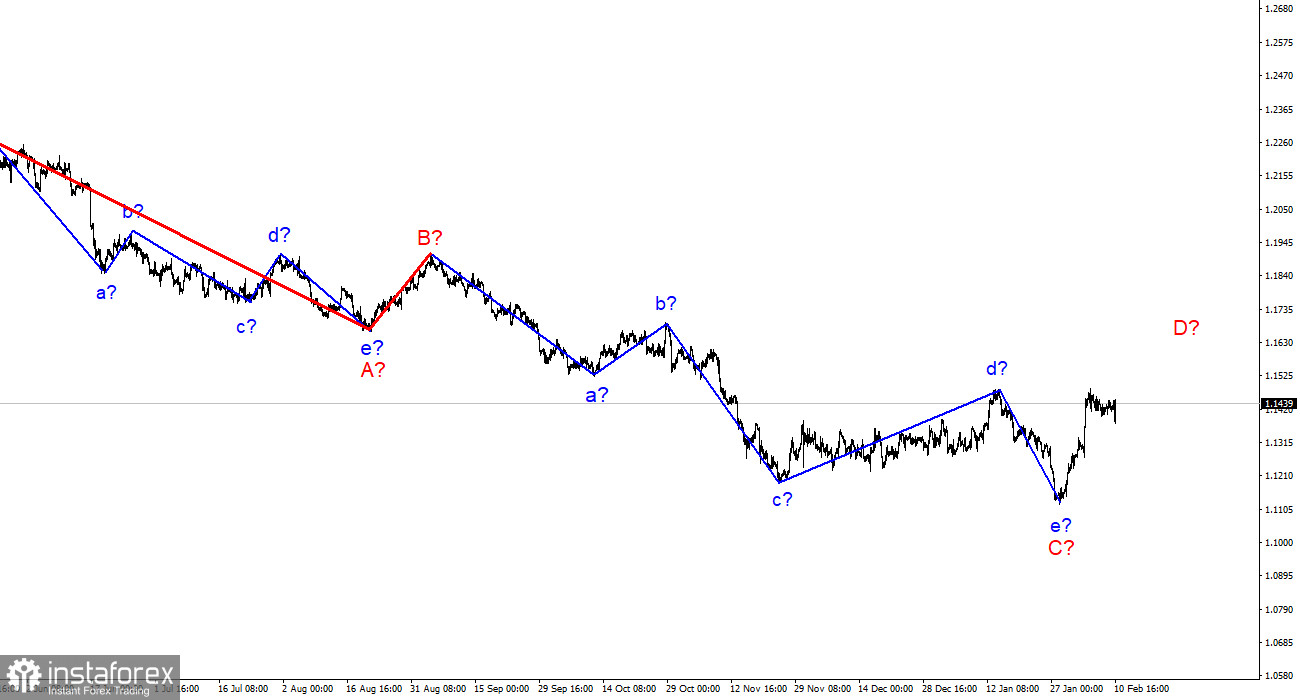
On a larger scale, it can be seen that the construction of the proposed wave D has now begun. This wave can be shortened or three-wave. Considering that all the previous waves were not too large and approximately the same in size, the same can be expected from the current wave. There are reasons to assume that wave D has already been completed, but a further increase in quotes will force us to reconsider this assumption.


