


Analysis of Thursday's trades:
GBP/USD 30M Chart
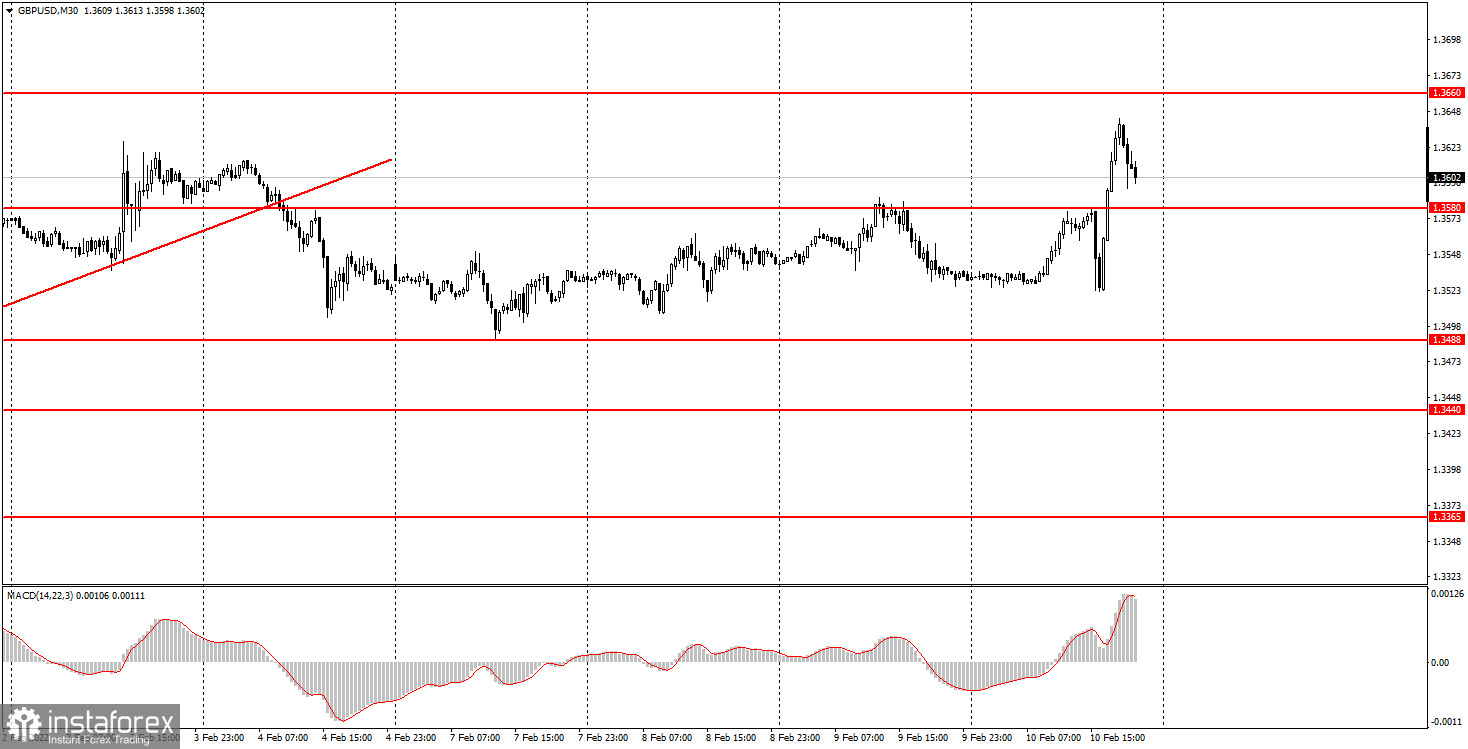
On Thursday, February 10th, the GBP/USD pair zig-zagged just like the EUR/USD. First, the cable dived but then it managed to recoup losses twice as much. By the end of the day, the pair was slowly approaching the early highs. All these perturbations were caused by a single report on the US inflation rate that showed an increase in the CPI to 7.5%. However, the reaction was as if several important reports were unveiled and traders had to revise their strategies all the time. As a result, the pair returned to the level of 1.3580. Probably, today's extremely volatile movements should be excluded from the general technical picture. Those moves were fueled by emotions just like after the ECB meeting. Currently, I can spot neither a trend line nor any channel to identify a trend. So, the only way out is to trade the levels.
GBP/USD 5M Chart
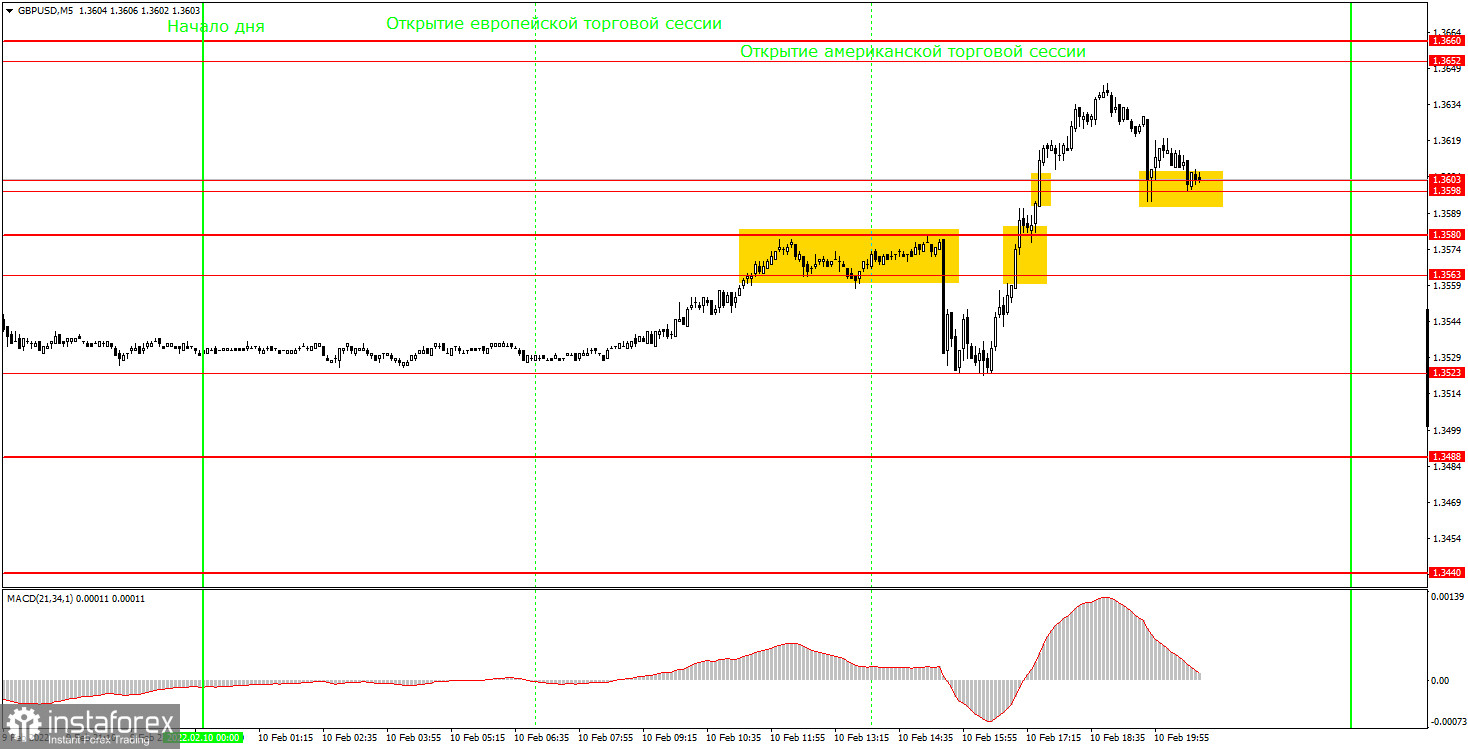
The 5M time frame shows havoc movements. Unlike the euro that at least tried to reach the key levels, the pound sterling remained in an indecisive mode. The first sell signal was formed after the pair had broken below 1.3563-1.3580. But by that time, the pair had already gone up about 50 pips. At that precise moment, the US inflation report came out. The next buy signal was formed after the pair had breached the area of 1.3563-1.3580 top to bottom. Shortly after that, it declined to 1.3598-1.3606. So, it was also premature to buy. A break above 1.3598-1.3606 gave a total addition of about 90 pips. It was risky to go long. But even if you dared to buy and the price increased 30 pips, you were unlikely to incur big losses thanks to a Stop Loss at a breakeven point. The next signal about a rebound from 1.3603 was formed too late, so it wasn't worth our attention. Overall, this day was not rich in signals, but still, it has brought some profits.
Trading plan for Friday:
The 30M time frame shows a reversal of an uptrend. For four days in a row, the pair was stuck between 1.3488 and 1.3580, i.e. in a sideways channel. Today, it demonstrated super volatile emotional dynamics. Based on the technical picture, there was neither a channel nor a trend line. The 5M target levels for tomorrow can be found at 1.3488, 1.3523, 1.3563-1.3580, 1.3598-1.3603, 1.3652-1.3660. If the price goes in the necessary direction at least 20 pips, you can set a Stop Loss at a breakeven point. Tomorrow, the UK GDP and Industrial Production reports will see the light. However, the monthly GDP data is unlikely to cause any strong reaction. Similarly, the industrial production data is of minor importance.
Basic principles of the trading system
1) The strength of the signal depends on the time period during which the signal was formed (a rebound or a break)/ The shorter this period, the stronger the signal.
2) If two or more trades were opened at some level following false signals, i.e. those signals that did not lead the price to Take Profit level or the nearest target levels, then any consequent signals near this level should be ignored.
3) During the flat trend, any currency pair may form a lot of false signals or do not produce any signals at all. In any case, the flat trend is not the best condition for trading.
4) Trades are opened in the time period between the beginning of the European session and until the middle of the American one when all deals should be closed manually.
5) We can pay attention to the MACD signals in the 30M time frame only if there is good volatility and a definite trend confirmed by a trend line or a trend channel.
6) If two key levels are too close to each other (about 5-15 pips), then this is a support or resistance area.
Reading a chart:
Support and Resistance price levels can serve as targets when buying or selling. You can place Take Profit levels near them.
Red lines are channels or trend lines that display the current trend and show which direction is better to trade.
MACD indicator (14,22,3) is a histogram and a signal line showing when it is better to enter the market when they cross. This indicator is better to be used in combination with trend channels or trend lines.
Important speeches and reports that are always reflected in the economic calendars can greatly influence the movement of a currency pair. Therefore, during such events, it is recommended to trade as carefully as possible or exit the market in order to avoid a sharp price reversal against the previous movement.
Beginning traders should remember that every trade cannot be profitable. The development of a reliable strategy and money management is the key to success in trading over a long period of time.


