As the US Bureau of Labor Records reported yesterday, consumer prices in the country continued to rise. The actual figures exceeded expectations. The monthly consumer price index came in at 0.6%, while the forecast was for an increase of 0.5%. On a year-on-year basis, the indicator also rose more than expected by 7.5% against a forecast of 7.3%. Notably, the consumer price index is a key indicator of inflationary pressures, and its growth increases the chances of an early tightening of monetary policy by the US Federal Reserve (Fed). So, I think it won't be long before the Fed hikes the rate for the first time in March, most likely by 50bp. I believe, it will happen more than once.
Meanwhile, European Central Bank (ECB) President Christine Lagarde believes that a rate hike will not solve the inflation problem. Moreover, according to Lagarde, a rate hike at this point in time could have a negative effect on the economy. The president of the ECB is confident that inflation will fall during the current year. Well, each of the two major central banks has a different stance on how to deal with high inflation. This difference in monetary policy too is no doubt having an impact on the currencies of these two political and economic giants, most of all on the euro. So, let's look at the price chart to see what changes have taken place on the main currency.
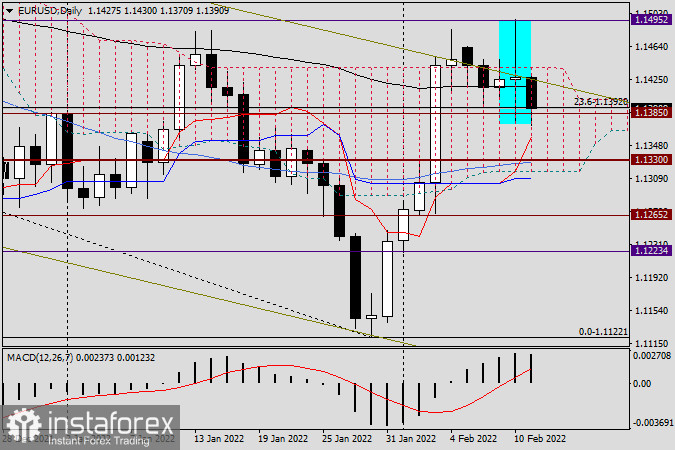
Daily

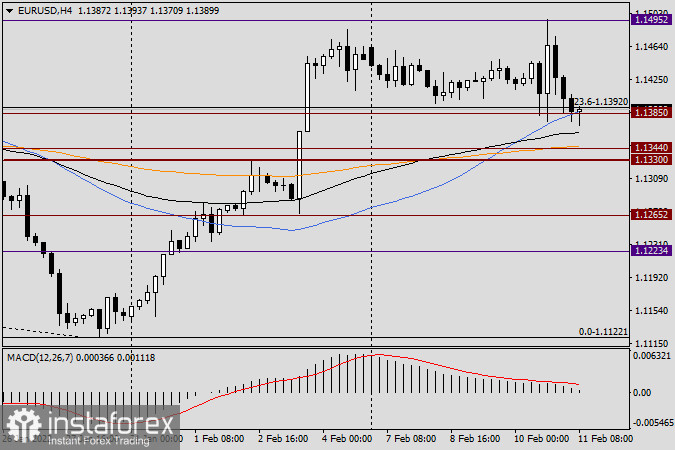
The fact that the euro bulls will have problems on the way to the most important psychological and technical level 1.1500 has been pointed out in previous reviews many times. In yesterday's trading, we saw it again. In yesterday's trading, there was a long-legged doji reversal candlestick pattern on the daily chart. The pair tried again to go up out of the Ichimoku cloud, but faced the strong resistance at 1.1495 and finished the trading on February 10, within the cloud at 1.1427. In fact, EUR/USD is trading much lower today at 1.1382. If today's and the week's trading end under 1.1400, then nothing good can be expected for the bulls. Only a change in market sentiment and the end of the weekly and daily sessions above the significant 1.1440 level, i.e. above the upper boundary of the cloud, can solve the problem.
H4


